Parties and favourites
In this unit we conduct a number of investigations using a party or favourites as a theme. Ākonga count, compare, organise, analyse, display and interpret data.
- Pose investigative questions.
- Plan for and collect category data.
- Display data in tally charts, pictographs and bar graphs.
- Make statements about data displays.
- Answer investigative questions.
At Level 2 you can expect ākonga to be posing (with teacher support) a greater range of questions, including investigative questions and survey questions. They will also begin to understand some of the issues involved in conducting surveys and learn new methods for collecting data. While at Level 1 ākonga collected data and chose their own ways to display their findings, at Level 2 they will be introduced to pictographs, tally charts and bar graphs. More emphasis here will also be placed on describing the data and the making of sensible statements from both the ākonga own displays and the displays of others.
Investigative questions
At Level 2 ākonga should be generating broad ideas to investigate. The teacher supports ākonga to refine their ideas into an investigative question that can be answered with data. Investigative summary questions are about the class or other whole group. The variables are categorical or whole numbers. Investigative questions are the questions we ask of the data.
The development of investigative questions is led by the teacher. Questioning of ākonga, leads to the identification of the variable of interest, and the group the investigative question pertains to. Ultimately, the teacher forms the investigative question with ākonga input.
Survey questions
Survey questions are the questions we ask to collect the data to answer the investigative question. For example, if our investigative question was “What ice cream flavours do ākonga in our class like?” a corresponding survey question might be “What is your favourite ice cream flavour?”
As with the investigative question, the development of a survey question is led by the teacher. Purposeful questioning of ākonga leads to the collaborative development of suitable survey questions.
Analysis questions
Analysis questions are questions we ask of displays of data as we start to describe it. Questions such as: What is the most common? What is the least common? How many of a certain category? What is the highest value (for numerical data)? What is the lowest value (for numerical data)?
Pictograph
In a pictograph, the pictures are drawn on uniform pieces of paper. This means that the number of objects in each category now bears a direct relationship to the size of each category on the display. An example is shown in the diagram below.
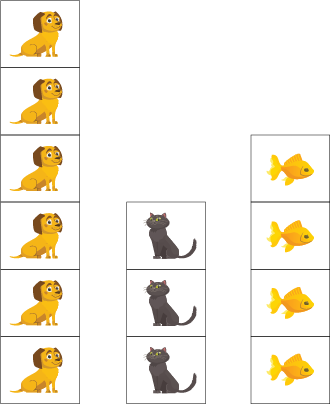
In a further development the pictures can be displayed on a chart with axes and titles. The vertical axis can be numbered to match the pictures.
Bar Graph
In a bar graph equal-width rectangles (bars) represent each category or value for the variable. The height of these bars tells how many of that object there are. The bars can be vertical, as shown in the example, or horizontal.
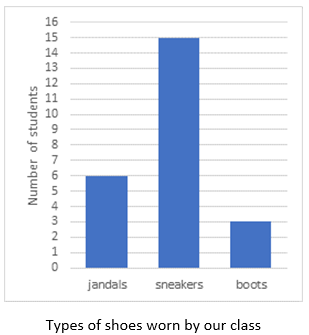
The example above shows the types of shoes worn in the class on a particular day. There are three types of shoes: jandals, sneakers, and boots. The height of the corresponding bars shows that there are six lots of jandals, 15 lots of sneakers and three lots of boots. It should be noted that the numbers label the points on the vertical axis, not the spaces between them. Notice too, in a convention used for discrete data (category and whole number data), there are gaps between the bars.
Tally Chart
A tally chart provides a quick method of recording data as events happen. If ākonga are counting different coloured cars as they pass the school, a tally chart would be an appropriate means of recording the data. Note that it is usual to put down vertical strokes until there are four. The fifth stroke is drawn across the previous four. This process is continued until all the required data has been collected. Tallying enables the number of objects to be recorded and counted quickly and efficiently (i.e. by skip counting in fives)
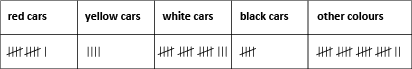
In the example above, in the time that we were recording cars, there were 11 red cars, four yellow cars, 18 white cars and five black ones and 22 cars of other colours. Microsoft Excel and Google sheets can be used to enter data into spreadsheets, analyse data, and create graphs. CODAP – Common Online Data Analysis Platform, is an online statistical tool that is accessible from a young age.
The learning opportunities in this unit can be differentiated by providing or removing support to ākonga and by varying the task requirements. Ways to support ākonga include:
- directing ākonga to collect category data or whole number data – whole number is harder
- providing ākonga summarised data to graph rather than them having to collect it and collate it
- providing ākonga a graph of the data and ask them to “notice” from the graph rather than having them draw the graph
- writing starter statements that ākonga can fill in the blanks to describe a statistical graph e.g. I notice that the most common ________ is ________, or more ākonga chose _______ than chose _______
- directing ākonga to present their data using an online tool
- supporting ākonga to make inferential nad literal statements about their data.
The context for this unit can be adapted to suit the favourites of your ākonga. Other possible contexts for this learning might be:
- planning a class party
- planning a special occasion (e.g. Fiefia night, Polyfest night, Matariki, Diwali, Kai festivals such as the Motueka Kai Fest, Hokitika Wildfoods Festival, Kāwhia Kai Festival, Bluff Oyster festival). Data could be gathered around the type of food to share, the activities to run, the venue to host the event at.
Te reo Māori vocabulary terms such as tuhuru (investigate) and pātai (question) could be introduced in this unit and used throughout other mathematical learning.
- Packet of balloons – different shapes and colours if possible
- Sheets of A4 cut into eighths (for uniformed squares to be used in pictogrpahs)
- Prepared bar graph outlines
- Popcorn and cups or bags
- Party props: hats, candles, cards, sweets, blind fold
- Access to online graphing tools
- Post it notes
Session 1: Balloons investigation
Today we will make a pictograph of our favourite balloon shapes. We are going to answer the investigative question “What different balloon shapes do the ākonga in our class like?”
- Take a bag of balloons and spread out. Discuss shapes. Suggest the investigative question “What shape balloons do the ākonga in our class like?”
- Ākonga choose favourite shape (or colour if different shaped balloons are not available) and draw it on a piece of paper (one eighth of an A4).
- Ākonga work together to discuss ways to display the data. If matching pictures in 1:1 lines (pictograph) is not suggested, direct them to this.
- Ākonga attach their drawing to the class chart.
- Ask the ākonga what they notice about the information shown on the pictograph. Use the prompt “I notice…” to start the discussion. These “noticings” could be recorded as "speech" bubbles or on post it notes around the chart.
- Talk about the need to label the axes and give the chart a title so that others could make sense of the display. The investigative question could be written as the chart title.
- Ask analysis questions to extend the noticing about the results that require ākonga to combine sets:
How many ākonga liked long wiggly balloons?
How many ākonga liked long straight balloons?
How many ākonga liked long balloons altogether?
How can you add the numbers together?
How many ākonga liked balloons that were not long?
How many more ākonga liked long wiggly balloons than long straight balloons? All ākonga counting methods should be valused in this activity. However, it may be appropriate for you to (model and reinforce the use of subtraction or addition, rather than counting on or back.)
Try to find analysis questions that will allow ākonga to use strategies such as near doubles and adding to make 10s.
Session 2: Birthday Party investigation
This birthday party investigation is described in full as a possible model for teaching and developing ideas for each of the stages of the statistical enquiry cycle at Level 2. In New Zealand we use the PPDAC cycle (problem, plan, data, analysis, conclusion) for the statistical enquiry cycle. You can find out more about the PPDAC cycle at Census At School New Zealand.
If the birthday party context is not suitable for your ākonga, choose another context (e.g. Diwali, matariki). The process described here will work for other contexts.
PROBLEM: Generating ideas for statistical investigation and developing investigative questions
- Ask ākonga to think about the topic of birthday parties. Explain that we are collecting some information to answer different investigative questions about birthday parties that we are going to pose.
Using the starter “I wonder…” Ask the ākonga what they wonder about birthday parties. Record their ideas. For example:
I wonder…- What are our favourite types of kai to eat at birthday parties?
- What games do we like to play at birthday parties?
- How many birthday parties have ākonga gone to? Consider whether this question might be inappropriate or emotionally distressing for your ākonga.
- Where do ākonga like to have their birthday parties?
- What birthday presents we want?
- What types of people go to birthday parties or school events?
- Using the “I wonder” prompt helps with generating investigative questions, questions we ask of the data. Record all questions and ideas on a brainstorming document (e.g. large chart, PowerPoint).
The amount of work needed to tidy up the investigative questions will depend on the responses of your ākonga in the brainstorming session. New Zealand based research has identified six criteria to support the development of and/or critiquing of investigative questions. These criteria are used in the example below. The teacher asks questions of ākonga to identify the information needed e.g. variable, group and with this information develops the investigative question.
- The intent of the investigative question is clear – we need to pose summary investigative questions (about category or whole number data)
- The variable of interest is clear e.g. favourite kai, number of birthday parties/school events ākonga have been to already.
- The group we are interested in is clear e.g. our class, Room 30, Kauri class
- We can collect data to answer our investigative question
- The investigative question considers the whole group e.g. What is Room 30's favourite kai to have at a celebration? – considers the whole group; whereas 'What is the most popular kai that ākonga in Room 30 like to eat at a birthday party – does not and is not an investigative question (it is an example of an analysis question and asks about an individual)
- The investigative question is interesting and/or purposeful – in this case if the ideas are generated by ākonga then we would expect them to be interesting to ākonga.
For the favourite kai at a birthday party example some possible questions are:
- What will we want to find out about? (Favourite kai at a birthday party)
- Who are we going to ask? (Our class)
- Do you think we could find this out by asking our class? (Yes)
- Are you interested in knowing about people's favourite kai at a birthday party? (Yes (if no, then change the question).)
For each of the ideas generated in part 1, possible investigative questions are:
- What are favourite kai at birthday parties for ākonga in Room 30?
- What are Room 30’s favourite birthday games?
- How many birthday parties have the children in Room 30 been to before?
- Where do Room 30 children want to have their birthday parties?
- What presents do Room 30 children want for their birthday?
- How many people do Room 30 children want at their birthday parties?
Each group selects one of the investigative questions to explore.
PLAN: Planning to collect data to answer our investigative questions
- Explain to ākonga that they need to think about what question or questions they will ask to collect the information they need to answer their investigative question.
Explain that these questions are called survey questions and they are the questions we ask to get the data. Work with groups to generate survey questions. For example:
- If the investigative question is: “What are the favourite birthday cakes for children in Room 30?”, ask ākonga how they could collect the data.
- A possible response is to ask the other ākonga “What is your favourite birthday cake?”
- This might lead to a discussion about whether they mean the flavour and/or the style (a possible way to extend this for some ākonga), e.g. I might respond my favourite birthday cake is a dinosaur, when they might have been meaning the flavour e.g. chocolate, banana etc.
- This might also mean that the investigative question needs adjusting to: What are favourite birthday cake flavours for children in Room 30?
- Also, the ākonga might want to ask, “What is your favourite birthday cake out of chocolate, banana, vanilla and carrot?” You could challenge them as to if this would really answer the investigative question and suggest that possibly they might change the survey question to allow for other answers.
Possible survey questions are:
- What is your favourite birthday cake flavour?
- What is your favourite game to play on your birthday?
- How many birthday parties have you been to before?
- Where do you want to have your birthday party?
- What presents do you want for your birthday? (this could give multiple answers, may want to change to what is the present you most want…)
- What is your favourite kai at birthday parties?
- How many people do you want to have at your birthday party?
- In these examples you can see that the survey question and investigative question are very similar, but there are key differences that make it an investigative question (What are favourite birthday cakes for the ākonga in Room 30? – overall about the class data) rather than a survey question (What is your favourite birthday cake flavour? – asking the individual).
- Ask ākonga to think about how they will record the information they get. Options may include:
- Tally chart
- Writing down names and choices
- Using predetermined options
- Using a class list to record responses
- Let ākonga try any of the options they suggest. They are likely to encounter problems, but this will provide further learning opportunities as they reflect on the difficulties and how they can improve them.
DATA: Collecting and organising data
- Ākonga collect data from the rest of the class using their planned method. You might provide a graphic organiser for your ākonga to use to organise their data. Consider also whether your ākonga need explicit instruction in how to record tally marks. Expect a bit of chaos. Possible issues that lead to useful teaching opportunities include:
- Predetermined options
- What happens for ākonga whose choice is not in the predetermined options?
- What if nobody likes the options given and they end up with a whole lot of people choosing "other"? They only have tally marks so they cannot regroup to new categories.
- Using tally marks only
- The discussed issue above about the “other” category
- Have fewer tally marks than the number of ākonga in the class
- and they think they have surveyed everyone
- or they do not know who they have not surveyed yet
- Have more tally marks than the number of ākonga in the class
- Possible solutions to the above issues could be (generated by the ākonga if possible)
- Recording the name of the ākonga and their response and then tallying from the list
- Giving everyone a piece of paper to write their response on, then collecting all the papers in and tallying from the papers
- Regardless of the process of data collection we are aiming for a collated summary of the results.
ANALYSIS: Making and describing displays
- Taking their summarised information, ākonga make a pictograph to help to answer their investigative question. As for the balloon activity we want to have uniform pieces. Provide:
- Squares of paper all of the same size for ākonga to create their own pictures
- Chart paper
- Ākonga give the chart a title – a good option is the investigative question.
- Ākonga make the pictograph by glueing enough pictures to represent the data they collected. This could be done by hand, or with an online tool.
- Teacher roams, questioning for understanding and ensuring that ākonga can correctly construct a pictograph.
- Once ākonga have completed their pictograph they should write or share 2-3 "I notice…” statements about their pictograph. These could be written on post it notes and stuck onto the chart. This could also be filmed and presented as a mini movie or set of slides with voiceover accompaniment.
- Teachers can prompt further statements by asking questions such:
- What do you notice about how many ākonga liked cakes that were not chocolate?
- What do you notice about the number of birthday parties attended? Did you notice the greatest number of birthday parties? The least number of birthday parties?
- Emphasise questions that require ākonga to operate with the numbers in their displays.
- Check the “I notice…” statements for the variable and reference to the class. For example: “I notice that the most favourite birthday cake flavour for Room 30 children is chocolate cake.”This statement includes the variable (favourite birthday cake flavour) and the class (Room 30 children). Support ākonga to write statements that include the variable and the group.
- Ask ākonga to leave their charts on their desks. Hand out post-it notes to the ākonga and ask them to wander around the class and to look at all the other graphs. Encourage them to add “I notice…” statements to the graphs of others by using post-it notes.
CONCLUSION: Answering the investigative question
At the end of the session get each group to share their chart. They should state their investigative question and then the answer to the investigative question. The answer should draw on the evidence from their graph and their “I notice…” statements.
For example: What are some favourite birthday cake flavours for children in Room 30?
Answer: The most popular birthday cake flavour for Room 30 is chocolate cake. 15 ākonga in our class had chocolate as their choice. The other flavours that were liked included carrot cake, banana cake and ice-cream cake. Carrot cake was the least popular cake flavour for Room 30.
Extending: If I (the teacher) was to make a cake for the class what flavour should I make?
Session 3: Popcorn
The previous session involved the full PPDAC cycle. In this session today we are going to look at using tally marks to record the number of pieces of popcorn in a small cup and a bar graph to display the data. We are focusing on the data collection and analysis phases.
- Display a small cup (or bag) of popcorn and ask ākonga to guess how many pieces of popcorn they think are in the cup.
- Pose the investigative question: How many pieces of popcorn are in the small cups?
- We are going to collect data to answer our investigative question by counting how many pieces of popcorn are in each of the cups I have here (count the number of pieces of popcorn in the small cup).
- How should we do that? Elicit ideas including counting them all. Ask how we could count them and keep a track? Accept all ideas including using tally marks to keep a track.
- Teacher models using tally marks to track how many pieces of popcorns she/he counts. Ensure hands are washed and tables are clean.
- Distribute individual cups of popcorn to small groups. You may wish to provide one cup of popcorn per ākonga, or use the tuakana/teina model and provide one between two.
- Ākonga count the pieces of popcorn and use tally marks to record the number of pieces of popcorn in each cup. They should add together the total of the tally marks each ākonga in the group recorded. (Record the number of pieces of popcorn in the cup, but don’t combine, later we will use each ākonga cup count as a data point).
- Gather the total tallies on the board or a chart.
- Using a prepared bar graph outline, the teacher constructs a bar graph with the information from the individual total tallies.
- Discuss features of the graph and summarise the information shown.
What was the most common number of pieces of popcorn?
What was the least common number of pieces of popcorn?
How many more pieces of popcorn were there in the cup with the most, than the one with the least? - As a class challenge, try to work out how many pieces of popcorn the class counted altogether.
How many pieces of popcorn did each table group count?
Discuss strategies for adding the numbers together (for example: combine the numbers that add to 'tidy' numbers; use place value; use doubles or near doubles).
Session 4. Favourites
In this session we will undertake a statistical investigation using the idea of favourites as our starting point. The big ideas for the investigation are detailed in session 2. Ideas to support the specific context are given here.
PROBLEM
Brainstorm with ākonga different things that they have a favourite of. You might use the starter “I wonder what are favourite _________ for our class?”
Using the ideas developed previously, identify 10-15 favourites to be explored and develop investigative questions for pairs of ākonga to explore. A tuakana/teina model could be used here.
Investigative questions might be:
- What are favourite sports that the children in our class play?
- What are our class’s favourite waiata?
- What are Room 30’s favourite kai?
PLAN
As ākonga have had some practice with planning previously, allow them some freedom, as appropriate, to plan their data collection. Check in on the survey questions they are planning to ask. Encourage ākonga to use the tuakana/teina model to support their learning journey.
DATA
Ākonga collect the data that they need to answer their investigative question. Be prepared for some potentially inefficient methods. Use any resulting errors or problems to improve their data collection methods.
ANALYSIS
Ākonga can display the data to answer their investigative question. They may use a pictograph or a bar graph. Remind them to label using the investigative question and to write “I notice…” statements about what the data shows.
CONCLUSION
Allow time for pairs to present their findings by giving their investigative question and then answering it using evidence from their displays and noticings.
Dear parents and whānau,
In math this week we are doing a statistics study on favourites. Can you please help us by filling in the survey form your child has produced to get some data about favourite things? If there is more than one person filling out this survey, please support your child to make space for this data collection.
Thank you.
Name:
| Favourite colour | |
| Favourite kai | |
| Favourite sports team | |
| Favourite subject when you were at school |
(You could adapt this list to meet with what your class is interested in)