This unit explores a variety of mathematical ideas, at Level 4 of the New Zealand Curriculum, in the context of Matariki. Matariki is a significant event in the New Zealand calendar and is celebrated in many schools. Matariki is an opportunity to engage in activities such as storytelling, astronomy, song, dance, and visual arts that have potential to enrich students’ mathematical experiences in meaningful contexts. New Year is also a chance to honour our ancestors, show care for our natural environment, and celebrate our bi-cultural and multicultural heritage.
Session One
- Recognise that the properties of a figure stay constant as the figure is rotated (turned).
- Use compass directions to locate objects.
- Represent the relationship between numeric variables using tables and graphs.
Session Two
- Collect, sort and display multivariate data to find patterns and differences.
Session Three
- Find rules for linear relations and represent those rules verbally, as equations and in graphs and tables.
Session Four
- Scale measures using percentages to create a kite to a given size.
This is an integrated unit which covers several important mathematical ideas. A summary of these ideas is discussed below.
Rotation is a transformation. A rotation is a turn that can be described as an angle about a given point and a direction of that turn. For example, Figure A has the Matariki cluster of stars in its most easily recognised position. Figure B shows the same cluster turned 90° clockwise.
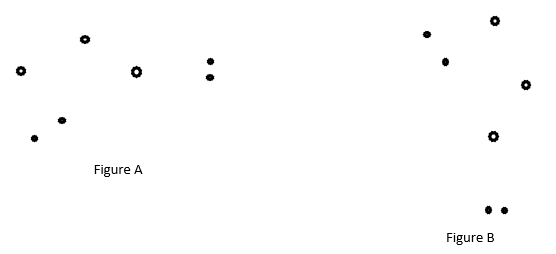
Mathematically we are interested in the features of the figure that stay consistent as it is rotated. These features allow us to spot the cluster however it is orientated. Distances between stars (as we see them) stay the same as does their position relative to each other. A trapezium connecting four stars will stay the same shape as the figure rotates.
Sessions one and three deal with relationships between variables. Variables are changeable quantities, for example, as year changes so does the date of Matariki. Associating changes in variables is an important idea in mathematics as it is the foundation of functions. Relationships can be represented in a variety of ways, including tables, graphs and rules. At level 4 students are not expected to generate formal algebraic notation for their rules, although many students will be capable of, and interested in, doing so. For example, a tukutuku panel might grow like this:
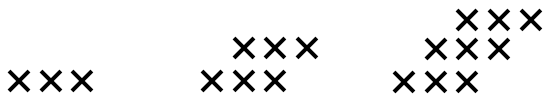
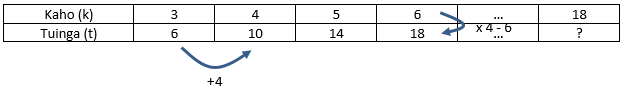
Each kaho (horizontal rod) has three tuinga (cross-stitches) so the pattern is easy. The data could be organised in a table or a graph.
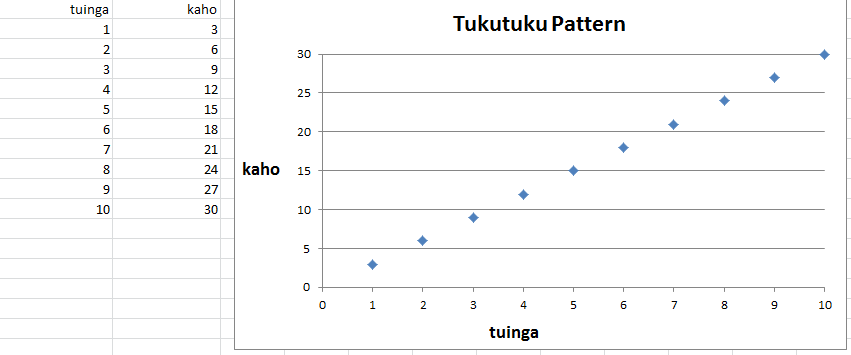
The number of tuinga increases by three for each extra kaho so the relation is linear. The graph shows points of a straight line. Rules for the pattern take two forms, recursive and direct or function. Recursive rules tell what is done to one term to get the next, in this case “add three”. A direct rule states how to get the value of one variable from the value of the other, in this case ‘multiply by three’. Direct rules tend to be more powerful than recursive rules though they can be hard to find for some patterns.
Session four involves percentages as operators. That means the percentages are used to scale (shrink or increase) the lengths of a template. Suppose we had a simple template like this. You need to put a mark 60% along the line.

The location of the 60% mark is dependent on the length of the whole line (100%). If the space between 0 and 100% is 30cm than the 60% mark is at 18cm (30 x 60 = 18). If the line is 40cm long the 60% mark is at 24cm. Useful strategies to find a percentage mark are to use 10% as a unit, or find the unit rate (i.e. what 1% is). 10% is found easily by dividing the length by ten and the unit rate is found by dividing the length by 100.
This unit is an integrated unit aimed at outcomes for Level 4 of the New Zealand Curriculum. As such, the activities range across the strands. All activities can be adapted to cater for the strengths and interests of students in your class. Ways to differentiate instruction might include:
- varying the complexity of the challenges. For example, keep the rotations of the Matariki cluster to quarter and half turns, or constrain the sorting, and display of data about ancestors
- varying the level of abstraction. For example, rotations and graphical display might be carried out physically, leading to anticipation of the result and findings about the context
- providing tools to support students. Tools might include technology, such as calculators and computers, flowcharts to organise the process of kite making, or templates for creating a table and graph of the tukutuku patterns
- explicitly modelling mathematical processes, such as scaling the dimensions on the kite template
- supporting the use of specific counting and addition and subtraction strategies in reflection of your students’ strengths and strategy knowledge
- modifying the numbers utilised in each session to suit the needs of your students
- grouping students to encourage tuakana-teina (peer learning) and mahi-tahi (collaboration).
Although the context of Matariki should be engaging and relevant for the majority of your learners, it may be appropriate to frame the learning in these sessions around another significant time of year (e.g. Chinese New Year, Samoan language week). You might ask students to share how New Year is celebrated in their culture and at what time of the year it occurs. Consider why our calendar New Year happens in the middle of summer, rather than winter, due to importing the calendar from the Northern Hemisphere. This context offers opportunities to make links between home and school. Make links to local and national Matariki celebrations. Consider asking family and community members to help with the different lessons. For example, members of your local marae, or a local kaumatua, may be able to share local stories and traditions of matariki with your class.
Te reo Māori language is embedded throughout this unit. Relevant mathematical vocabulary that could be introduced in this unit and used throughout other learning include tātai (calculate, calculation), huri (rotate, rotation), whakaata (reflect, reflection), neke (translate, translation, move), ture (rule), kauwhata (graph), tūtohi (table of data, chart), raraunga (data), koki (angle), taurangi (variable), putu (degree - angle and temperature), and maramataka (calendar).
Prior Experience
This unit is targeted at Level 4 so students are expected to have experience at Level 3 including:
- Creating tables and graphs for simple relations
- Knowledge of common graphs for category and numeric data, e.g. stem and leaf, bar graph
- Measurement with metric units
- Simple percentages
Session One
In this session students investigate some of the mathematics of astronomy associated with the rising of Matariki. They learn to recognise the cluster of stars irrespective of orientation. They also learn where to look for the stars at the beginning of Matariki and how the date of the New Year is determined.
Use PowerPoint 1 to organise the lesson.
- Slide 1: Why is the star cluster Matariki important in Aotearoa/New Zealand at this time?
Matariki is a cluster that wanders the skies in relation to other star formations. For eleven months of the year it is visible as it wanders. In early May it disappears below the horizon and reappears close to the horizon in late May/Early June. The ‘rising of Matariki’ refers to its appearance above the horizon just before dawn. That is why it was used as a consistent marker to determine the New Year. So the first new moon following the ‘rising of Matariki’ is when the New Year begins, but celebrations occur in the last quarter of the lunar cycle before. - Slide 2: How will you recognise Matariki when you see it?
There are seven stars in the cluster visible to the naked eye, though another two stars can be seen by some with keen eyesight or with binoculars. As a cluster, the seven stars stay in the same formation like a squadron of stunt pilots. However, the cluster appears facing different directions at different times which can make it hard to spot. - Give the students Copymaster 1 which includes the star cluster in different orientations. Ask the students to find a way to know if the cluster they see is Matariki. After all, there are billions of stars in the sky.
- When they return, ask the students what methods they use to organise the way they view the cluster. Typically this involves using shapes, relative position and size of the stars are important characteristics. You might put the students in small groups to share their organisations with the aim of creating the easiest way to recognise Matariki. Get the students to apply their organisations to Slides 3-6.
- Slide 3: This is Matariki rotated 120° (⅓ turn) clockwise from the arrangement on Slide 2. A good question is why the Slide 2 position is easy to recognise. For example, the two right hand stars Tupu-ā-rangi and Tupu-ā-nuku are aligned vertically. Students will have other reasons.
- Slide 4: This is Matariki rotated 210° clockwise or 150° anti-clockwise. An important discussion point is the similarity of effect for these two rotations.
- Slide 5: This is not Matariki as the relative location of Waitā has been changed (moved to the right). If the students have used shapes to organise the cluster then the shift will be obvious.
- Slide 6: This is a reflection of Matariki so is not how the cluster can appear. Discuss why a reflection (flip) is not a valid transformation while a rotation is.
- Slide 7: This shows one way to organise Matariki using a rhombus and an isosceles triangles. Share the other ways students used to organise the cluster geometrically. Mention that using figures to describe the arrangement of star clusters is common across cultures.
- Slide 8: Here you will find instructions about locating Matariki in the sky as it rises an hour or so prior to dawn in the North-Eastern sky. Give your students a Google Map of your local area so they can identify some landmarks to look for to identify East and North-East or let them use the app if you have technology available.
- Celebrations for Matariki, the New Year, occur after, but not on, the day of the first New Moon after the rising of Matariki in the dawn sky (Late May/Early June). Find out what date Matariki is celebrated this year. You may want to use TimeAndDate.com to help.
The site will show the quarters of the lunar cycle like this: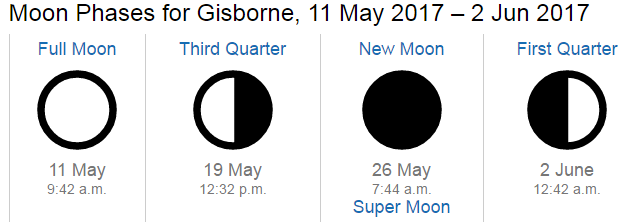
- Ask the students, “How many days are in a lunar month?” A lunar month is 29.5 days (New moon to new moon) so it does not match the calendar months of 28-31 days we use. Ask, “So how long does each quarter take?” (About 7 days)
- You might ask your students to act out the rotation of the moon around the Earth, using a ball and an OHP projector or torch. Acting out the rotation will show if your students understand why the phases of the moon occur. There are videos available online that also demonstrate this. Search for "Phases of the moon video".
- Ask the students to find the date of the first full moon in June. You might ask students to find the dates of Matariki for the next few years. TimeAndDate.com is a useful resource for this.
- Ask: Is there a pattern to the dates? Why do the dates vary when the date of Matariki rising is consistent? (The lunar calendar has a different month to the calendar we use).
You might ask the students to graph the relations, preferably using Excel or another app. The graph reveals a cycle like this that might predict future and previous dates for Matariki. The lines in this graph show the cycle even though the points are discrete (individual). The cycle is erratic, unlike a tide timetable or the pattern of seasons, because the timing of Matariki is dependent on two different patterns. The star cluster varies in the date it first rises each year, and the lunar cycle of 29.5 days does not match our calendar months.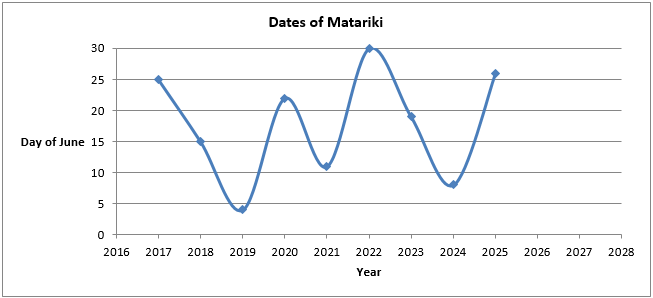
Session Two
In this session students investigate the significance of Matariki as a time of remembering ancestors. Ask students to choose an ancestor of their own who has passed in the last year or select a famous New Zealander from an online database. They look at data about the deceased, particularly the nature of the contribution the ancestor has made to the lives of others.
- Play the section from 31:57 to 35:24 in this inspiring lecture by Dr Rangi Mātāmua about Matariki.
Dr Mātāmua shows how the star Matariki is at the bow of the great canoe Te Waka o Rangi. The rising of Matariki signals a time of letting go of the dead from the year before so their souls can be gathered in the trawling net by Taramainuku who casts them into the heavens. In that way our ancestors become stars. - Begin with the Figure It Out task “Family Trees” from Figure It Out, Link, Number, Book Four, Family Trees, page 13.
- Use PowerPoint 2 to organise the remainder of the lesson.
- Slide 1: Ask, “What is this diagram about?” Some students may know that it shows some of the children of Ranginui and Papatūānuku, the first Māori ancestors. Ask, “What is meant by whakapapa? Why is whakapapa important?”
- Slide 2: This is a picture of Tāne Mahuta, the giant kauri tree in the Waipoua Forest, in Northland (Tai Tokerau). It is named after one of the children, Tāne-mahuta, God of the forest.
- Slide 3: Ask, “What does this picture show?” The diagram shows a bloodline going backwards in generations from a single offspring.
Ask, “Why does it say biological whakapapa?” Children do not always live with their parents and sometimes adults find new partners. So the problem has been simplified. Some children have brothers and sisters, and cousins. Great Aunts and Uncles are also referred to as tīpuna. - Tell the students to work in small groups to solve the problem on slide 3. Purposeful groupings, that include a mix of abilities and mathematical confidence levels, may be crucial in this task. Students are expected to work with large numbers. Allow them access to calculators and computer spreadsheets if necessary. Look for your students to organise the calculations. A table like this is useful, and could be provided to students as a graphic organiser. Encourage students to use formulae rather than repeatedly copying sequences. You may need to explicitly model how to use formulae. Some examples of formulae that can be filled down are shown. Formulae allow students to fill down the table for as many generations as they want.
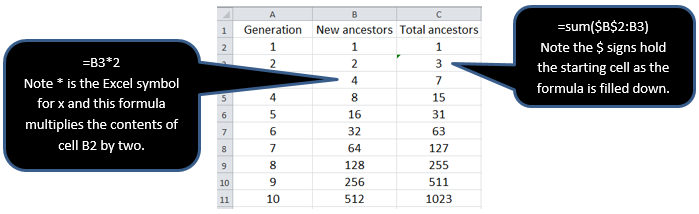
So the total number of ancestors in a biological whakapapa is 1023 after ten generations. - Ask: Is the second column of numbers familiar? What set of numbers is that?
These numbers are powers of two and can be written in index notation, e.g. 32 = 25. Note that 25 can be written as 2 x 2 x 2 x 2 x 2 (two multiplied by itself five times). - Ask: Is there a quick way to find the value of Column C if you know the value of Column D?
Students might notice that the Column C numbers are one less than double Column B, e.g. 1023 = 2 x 512 – 1. - The final question asks how many biological whakapapa make up the 100 Billion stars in the Milky Way. Students might interpret this in at least two ways:
- How many generations down the table would it take to reach 100 000 000 000?
The result is surprising as it only takes only 37 generations to get 137,438,953,471 ancestors. Note that you will need to custom format the cells to take large numbers before you fill down the table columns. If each generation is 25 years apart then there are 4 generations in each century. - How many centuries equal 37 generations? (37 ÷ 4 = 9.25)
- How many whakapapa of 1023 would make 100 000 000 000?
1023 is about 1000 so 100 000 000 000 ÷ 1023 ≈ 100 000 000 (one hundred million)
- How many generations down the table would it take to reach 100 000 000 000?
- Remind the students that Matariki is a time to acknowledge the dead prior to the beginning of the New Year. According to custom, as their names are read out at dawn the souls of the deceased are cast into the heavens to become stars.
- Invite the students to choose a deceased person to acknowledge. The person might be a member of their whānau, someone they knew, or a famous New Zealander who passed recently.
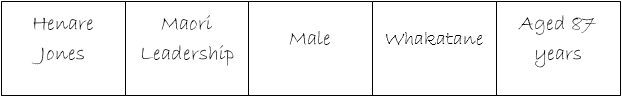
- Allow students to develop a short acknowledgement of the person, researching on the web if they need to. That acknowledgement should include the contribution the person made, their gender, their location, and possibly their age of death. You might choose to undertake a data based investigation. Students could create data cards about their person for easy sorting:
- Ask: How might we group the reasons we chose our people?
Students should create categories like family, sport, arts, leadership, business, education, to sort the people into. The person might belong in several categories. For example, Henare might have been a politician as well as a leader. - As a class you might create data displays and look for patterns in the data.
- We tend to value our whānau and sports people most.
- Most of our people lived beyond 60 years.
- To conclude the lesson, show the students the story of the creation of sky and earth, beautifully told by Beth Te Aro (see YouTube links below). According to the legend Tāwhirimātea, God of Wind, was so angered by the actions of his siblings that he pulled out his eyes and threw them into the heavens. Another version says that he threw his tears. His eyes or tears formed the stars of Matariki. For this reason Matariki translates to “The eyes of God” or “Little eyes.”
- Ranginui and Papatuanuku - part one (YouTube)
- Ranginui and Papatuanuku - part two (YouTube)
Session Three
In this session students follow the connection of Matariki as a time to honour the dead and the responsibility of the living to strive for excellence. Matariki occurs in the middle of winter. Traditionally this was a time when adequate food was stored and whānau engaged in cultural pursuits like story-telling, games, creating art works, and singing. So it is appropriate for students to learn about the mathematics of tukutuku panels that adorn the wall of wharenui (meeting houses) of marae. Students look at a traditional design called kaokao. Toothpicks could be for students to communicate and refine their thinking around patterns and rules. Use PowerPoint 3 to organise the lesson.
- Slide 1: This kaokao pattern symbolises the strength of the warrior.
- Slide 2: This slide introduces the two components of some tukutuku:These two components form the variables in the pattern when you consider it from an algebraic perspective. The kaokao pattern has reflective symmetry which can also help students to solve the difficult challenges that lie ahead.
- horizontal wooden rods or laths, usually coloured red or black, called kaho;
- cross stitches, made from a variety of coloured fibres, called tuinga.
- Slide 3: This slide introduces the task, completion of which will enable your students to increase their knowledge. Provide students with Copymaster 2 so they can draw over the pattern in an effort to find an easy way to calculate the number of tuinga.
- Once the task is introduced, allow students to work collaboratively in small groups. Look for these things as your students work:
- Do they partition the kaokao into useful ‘chunks’ that mean one-by-one counting is not needed?
- Do they use tables to organise the data they get about the pattern? Consider providing a table template for students to use.

- Do they notice patterns in the table?, e.g. Four more tuinga are added for each kaho
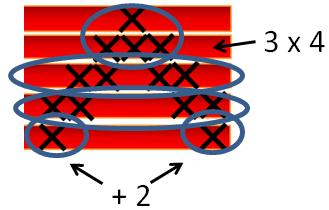
- Do they use equations to record the way they partition the kaokao into ‘chunks’? , e.g. 3 x 4 + 2 tuinga for 5 kaho. This will draw on students’ understanding of the order of operations (BEDMAS) and may require additional explicit teaching and modelling.
- Your ākonga (students) are likely to need a significant time to investigate the pattern. Encourage them to find different ways to ‘see’ the kaokao, that is partition it into useful ‘chunks’. After an appropriate time, bring your ākonga together to share strategies they used to solve the problem.
- Look at sophistication and efficiency. A strategy that involves adding fours may work for 18 kaho but it will be very cumbersome for 100 kaho. A multiplicative strategy like, “I take two off the number of kaho, multiply that by four then add two”, is much more efficient. A student who invents that would be further up the kaokao than a student who adds. Encourage your ākonga to connect their symbolic recording to the ‘chunks’ they ‘see’. Here is an example, for the multiplicative rule above:
- Ask students who are presenting to use tables to organise the data. Rather than using recursive (additive) rules encourage them to look for direct (multiplicative) rules as shown below.
- You might choose to record the general rules in words or equations, such as:
"Take two off the number of kaho, multiply the answer by four, then add two” can be written as , where t is the number of tuinga and a is the number of kaho. - Slides 4-7 are aimed at your ākonga ‘seeing’ the kaokao in different ways to create different general rules. These ways of seeing may have already been used by your students.
- Slide 4: Whetu notices groupings of two. She could record:

- Her challenge is to write the multiplier of two in terms of the kaho number. Notice that 3 is the 2nd odd number, 5 is the 3rd odd number, 7 is the 4th odd number. So for 18 kaho she would find the 17th odd number and multiply that number by two. The 17th odd number is 33 so the number of tuinga is 33 x 2 = 66. She could write her formula as 2[2k-3]=t since 2k-3 gives the k-1th odd number. This formula is quite complex but some ākonga may find it.
- Slide 5: Rawiri sees a collection of six tuinga at the start of the kaokao with three kaho. He notices that four tuinga are added for each new kaho. For 18 kaho he will know that 18 – 3 = 15 sets of four tuinga will be added to the original six. So he would calculate 15 x 4 + 6 = 66. In general, the rule is “Take three off the number of kaho, multiply the answer by four then add six” or 4(k-3)+6=t.
- Slide 6: Anikiwa sees two halves to the kaokao and she joins the halves together. She notices that two tuinga overlap. If she created a table for each half of the kaokao it would look like this:

- If she doubles each ‘half’ (for left and right) and remembers to take off the overlapping two tuinga she will get this table.

In general her rule is, “Take one of the kaho number and multiply it by two. Multiply that answer by two then subtract two” or 2[2(k-1)]-2=t. - Slide 7: Kahu notices that there are three lots of four in the kaokao for five kaho. So he adds tuinga so there are five lines of four. Five multiplied by four is easy to calculate (5 x 4 = 20) then he takes away the six tuinga he added.
For 18 kaho Kahu will make 18 x 4 = 72 tuinga, then subtract six to get 66 tuinga. In general his rule is “Multiply the kaho number by four then subtract six” or 4k-6=t. - Slide 8: The final slide for the lesson gives your ākonga a chance to apply their ‘ways of seeing’ to a new kaokao pattern. In general there are six tuinga per kaho except for the four tuinga that are attached to the top two. You might ask your students to work on this task independently before sharing with others.
Session Four
Matariki was traditionally a time when kites were flown. Some iwi believe that flying kites helps us to get closer to our ancestors whose souls are embodied as stars in the sky. In previous times kites were made from everyday materials, toetoe, raupō and harakeke (flax).
This YouTube video shows examples of traditional manu tukutuku (kites):
- Ask: How do you think the kites were constructed from natural materials?
- Toetoe formed the skeleton or frame of the kite, raupō leaves formed the sail, and flax was used to tie the parts together, and as the line. Often kites were made in the shape of birds. These kites were ‘delta kites’ as they were based on a single triangle (tapatoru). Plans for making a delta kite can be found in Copymaster 3.
- If natural materials are hard to come by then it is still appropriate to use recycled materials in keeping with the environmental focus of Matariki. The sails can be made from materials such as vinyl wall paper or tough plastic rubbish bags. Bamboo garden stakes, long skewers, or lengths of dowel make good spines and struts for the skeleton. Traditionally Māori used supplejack for framing their kites.
- The size of manu tukutuku (kite) that your ākonga might make is constrained by two things, the size of the rectangle of material and the length of the rods that will form the frame. For example, bamboo skewers are 30cm long and will fit along the side labelled 75%. Longer lengths of dowel or bamboo up to 150cm might also be used. So the size of the sail and keel will need to be adjusted accordingly which is an excellent opportunity to apply percentages. This is an excellent application of proportional reasoning. If 30cm skewers are used, 75% is about three-quarters so 100% must be 1⅓ of 30cm which is about 40cm. Many of the measurements can be estimated accurately, e.g. 10% is one tenth. If you are using 30cm skewers the measurements become:

- All measurements can be scaled for a larger manu tukutuku. Ask the students to sketch the dimensions of their plans on paper before they cut out the materials. Get other students to check their calculations.
- Traditionally kites were flown on the morning of the new moon. You might like to organise a dawn viewing of Matariki and a kite flying regatta to welcome the arrival of new stars in the heavens.
Dear parents and whānau,
Our next mathematics unit is based on Matariki in recognition of the celebration of the Māori New Year. We will investigate mathematics in the astronomy of Matariki, how the date is decided and how to recognise the cluster of stars in the dawn sky.
We will also learn about the significance of whakapapa, our family tree, and the mathematics of our descendants as we go back generations. A famous tukutuku design will help us learn some algebra and we will finish off using percentages to build kites to fly at the Matariki celebrations.