The purpose of this activity is to engage students in evaluating a claim made on the basis of supporting statistics.
This activity assumes the students have experience in the following areas.
- Calculating sample statistics such as mean, median, and range.
- Comparing distributions using measures of centre and spread.
- Making a call about differences between distributions.
The problem is sufficiently open ended to allow the students freedom of choice in their approach. It may be scaffolded with guidance that leads to a solution, and/or the students might be given the opportunity to solve the problem independently.
The example responses at the end of the resource give an indication of the kind of response to expect from students who approach the problem in particular ways.
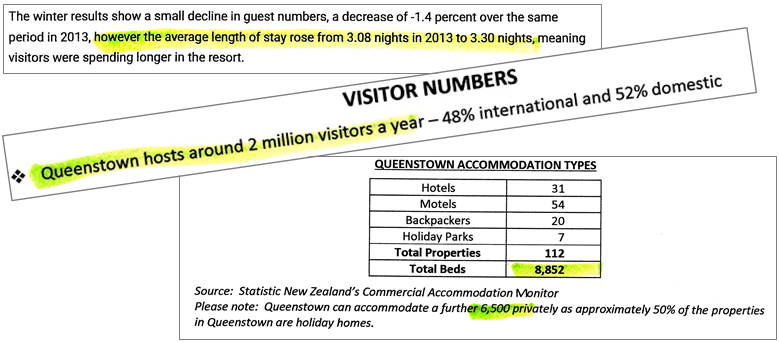
A tourism website makes the claim that Queenstown hosts around 2 million visitors a year.
Read the extracts from the statistical report and comment on the validity of the claim.
The claim is in The Queenstown Quick Reference Guide (PDF, 1.8MB)
Downloaded from http://www.queenstownnz.co.nz/ on 17/01/15
See also the Statistics NZ website for baseline data.
The following prompts illustrate how this activity can be structured around aspects of Statistical Literacy.
Data Source
The section is about the reliability of the data sources being used.
- Are the data provided relevant to the claim posed in the report? (The report provides data about trends in guest numbers and average length of stay, as well as numbers of different accomodation types.)
- Is more information needed to evaluate the claim? Which information? (Students might consider that some other information is needed, particularly the number of Air BnBs and privately owned homes available. Camping, including motor homes, is also an important part of accomodation in Queenstown.)
- Do you need to make assumptions to evaluate the claimn? What assumptions? (Beds can hold 1 or 2 guests so an average will be needed, such as 1.5. Occupancy rates for the given accomodation will need to be assumed.)
- Are the data sources acknowledged and are these sources reliable? (The sources are given and are relaible organisations.)
Evidence for the claim
The section is about the validity of the data and how it is used to support the claim.
- Does the evidence provided justify the claim? (The report uses bed numbers of certain establishments but ignores other that are relevant. It does not provide occupancy rates.)
- Is evidence missing that would further validate the claim?
- Are there weknesses in the evidence presented, included other explanations for variations in the data? (The report does not acknowledge any explanations for changes to average stay and this may be due to natural variation.)
Strength of the claim
The section is about the adequacy of the data and other factors than may have influenced the findings.
- Is the data adequate to support the conclusions? (This includes issues about the sampling, such as size and representativeness. Since total number of establishments is given, sampling is not relevant except with the exclusion of other types of accomodation.)
- Are some factors ignored in the claim?
- What further investigation is needed to support the claim?
- Does my analysis of the data support the claim, or refute it?
- How will I convince others that my analysis makes sense?
Examples of work
Work sample 1
The student comments on the claim and refers to relevant statistics in making judgements about the claim.
Click on the image to enlarge it. Click again to close. 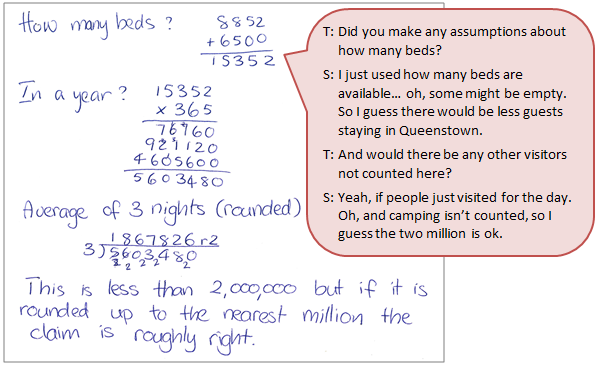
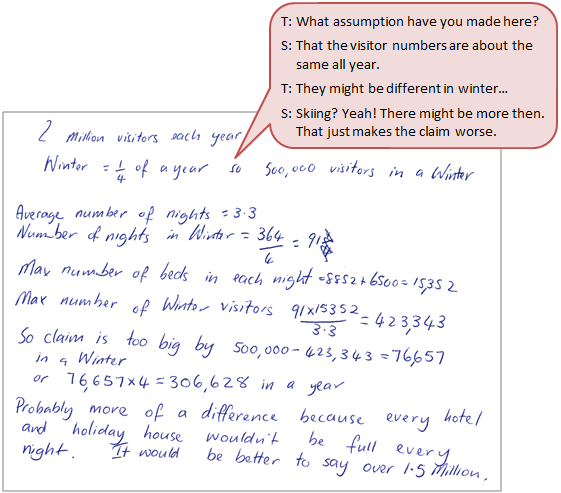
Work sample 2
The student evaluates the claim made, and independently selects the relevant statistics to justify their view.
Click on the image to enlarge it. Click again to close.