This problem solving activity has a statistics focus.
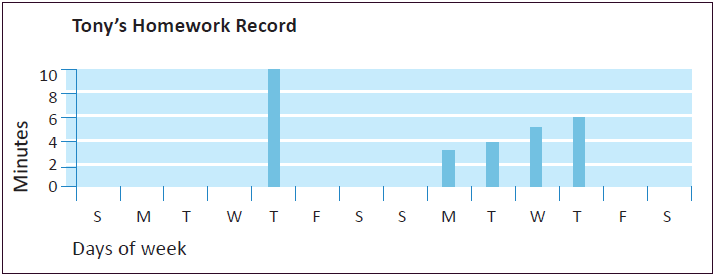
Tony wants to become a better speller so he keeps a record of the time he spends learning his words each night. He also asks his mum to test him each day and he writes the number of words he gets correct.
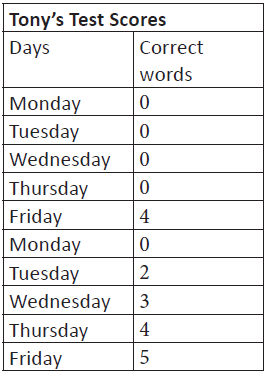
Look closely at Tony's data.
What do they tell you about Tony’s homework patterns?
Write the advice you would give him so he gets all words correct.
- Describe in their own words the situation represented in a bar chart and tally chart.
- Use a bar chart and frequency table to make sensible predictions.
- Interpret information and results in context.
This problem builds on students' understandings of how to read bar graphs and frequency tables.
It challenges students to think logically about a familiar situation represented by data, and to draw reasonable conclusions. Students are encouraged to use everyday language to respond to mathematical ideas.
The Problem
Tony wants to become a better speller so he keeps a record of the time he spends learning his words each night. He also asks his mum to test him each day and he writes the number of words he gets correct.
Look closely at Tony's data.
What do they tell you about Tony’s homework patterns?
Write the advice you would give him so he gets all words correct.
Teaching Sequence
- Discuss with your students their own homework 'spelling habits'.
- Read the problem together. Invite students to comment on Tony's data.
- As appropriate for your students, have them solve the problem independently, or in pairs, Alternatively,
you might further check understanding using questions such as:
Look at the bar chart. What days did Tony do the most homework?
Why do you think he did more homework on Thursday nights?
Why do you think he didn’t do homework on Monday nights or in the weekend?
Look at the frequency table . What information is recorded on it? How else could we record this information? (e.g. with a tally chart).
How well did Tony do on Friday’s spelling tests?
Why do you think he did better on Fridays than on Tuesdays?
Did doing more homework in the second week make any difference to Tony’s test marks?
What advice could you give Tony about doing homework? - Draw attention to the different variables measured, and talk about how else the data could be recorded (e.g. pie chart, dot plot, tally chart).
- The aim of this discussion time is to get the students to be familiar with the charts and to become fluent in how to read them. They should be able to predict that the more homework he does the more words he gets correct. They might also practise 'reading between the data' and give statements such as "maybe Tony didn't have homework over the weekend".
- Have the students decide how much homework they think Tony should do each night to get all his words correct on Friday. They may want to show this on another bar chart.
- Have students write their advice for Tony. This could be linked to persuasive writing.
Extensions
Have students keep a record of their own homework patterns (or time spent practising multiplication tables, reading books and number of books read, practising a musical instrument and number of songs played etc.). Have students graph their data using a paper template or digital tool (e.g. Google Sheets).
Have students continue the charts showing Tony’s improvement after following their advice.
Solution
Tony's spelling improves with practice.
Each night he does homework he gets more words correct.
Students' advice for Tony might include:
- Don't leave your homework till Thursday nights. It doesn’t give you enough time to learn all the words.
- I think you should do about 5 minutes spelling homework every night.
- If you did just a bit of spelling at the weekend too, it would help you to be a better speller.