This is a level 3 algebra strand activity from the Figure It Out series.
A PDF of the student activity is included.
Click on the image to enlarge it. Click again to close. Download PDF (757 KB)
use a spreadsheet tofind relationships between numbers in a pattern
FIO, Level 3, Algebra, Spreadsheet Challenge, pages 12-13
classmate
A spreadsheet is a useful teaching tool in mathematics. It will repeatedly perform calculations, following formulae that students have entered.
Important: Before students attempt this activity, do the challenge yourself on the computer that students will be using, and make sure that you know how to write formulae and what the menu commands are. The spreadsheet you are using may have different terms from the ones described in the students’ book.
You may need to show students how to use spreadsheets before they do this activity. Make sure they know:
• what a spreadsheet is
• what a cell is
• how cells are labelled
• how to enter data or formulae into cells.
The following is included for teachers who are unfamiliar with spreadsheeting.
You can type straight into these cells. When you put the cursor in the cell and click there, a border appears around that cell and when you begin to type, your typing appears at the top of your document rather than in the box. When you press return or enter, the cursor moves to the next cell and the typing appears in the cell where you want it to appear.
You can arrange the position of your typing by going to the alignment part of the Format menu.
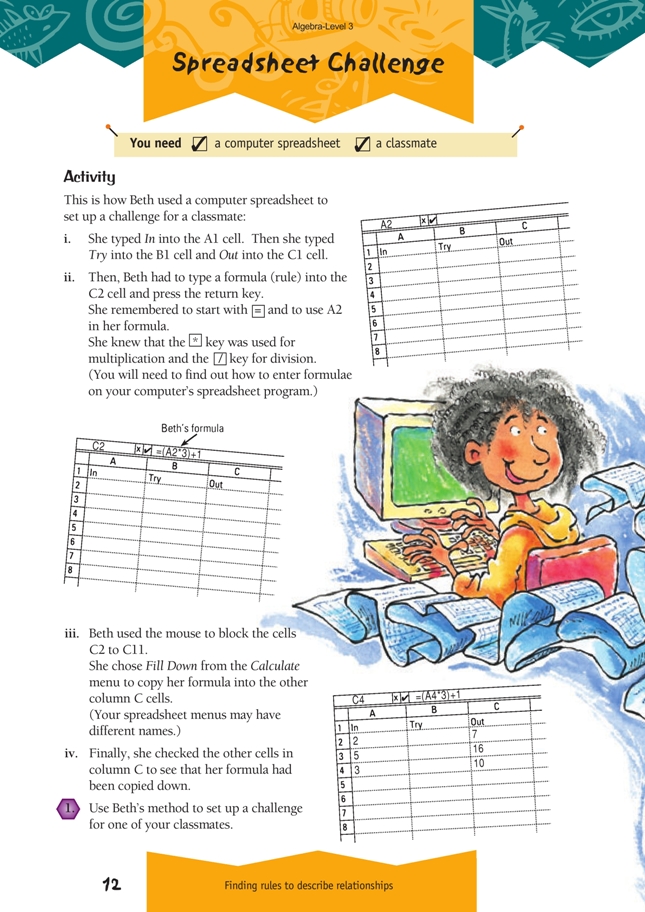
Row 1 is usually where the headings for the columns in a table are put, for example, “In”, “Try”, and “Out”, as given on page 12 of the students’ booklet.
To enter a formula:
Type a formula such as =(A2*3)+1 in a cell (a different cell from A2). The = tells the computer that you are entering a formula. The answer appears in the cell that contains the formula. (The formula works on whatever is already in the A2 cell. If, for example, 4 were already typed into the cell, the answer would be 13.)
To copy this formula down the column, put the cursor in the cell containing the formula, hold the mouse button down, and drag the cursor down the column as far as you wish.
Release the mouse, go to the Calculate menu, and choose the Fill down command. This will then fill in the missing values.
To practise using formulae on the spreadsheet, students could try entering some of the rules or formulae that they identified in the pattern exercises on pages 1 and 2 of the students’ booklet.
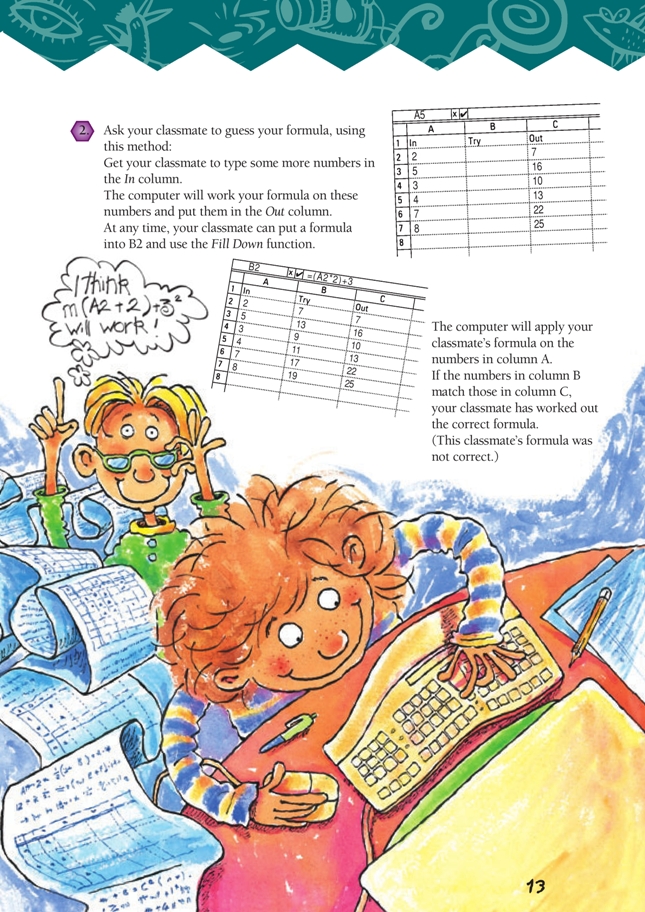
You could point out to students that the spreadsheet is just like Simon’s operations machines on pages 10–11 of the students’ booklet. But in this activity, they have to work out the rule rather than working out the in and out numbers. This activity reinforces the skills used on pages 10–11, and students should look for patterns in the In/Out tables in the same way that they did on the earlier pages. For example, are the in numbers bigger or smaller than the out numbers? If they are bigger, addition or multiplication has probably been used. If they are smaller, subtraction or division has
probably been used. Is the difference between each consecutive in number the same as the difference between each consecutive out number? If so, only addition or subtraction will have been used. If not, multiplication or division will have been used.
As an extension, you could ask students to investigate what kind of graphs their computer can make from the data in the In/Out tables.
Answers to Activity
Answers will vary.