This is a level 3 statistics activity from the Figure It Out series.
A PDF of the student activity is included.
Click on the image to enlarge it. Click again to close. Download PDF (1509 KB)
express a probability as a fraction
calculate percentages
estimate costs using probabilities
This diagram shows the areas of Statistics involved in this activity.
The bottom half of the diagram represents the 5 stages of the PPDAC (Problem, Plan, Data, Analysis, Conclusion) statistics investigation cycle.
Statistical Ideas
Spin to Win! involves the following statistical ideas: using the PPDAC cycle, investigative questions, category data, tally charts, and graphs.
A computer spreadsheet/graphing program (optional)
FIO, Levels 3+ -4, Statistics in the Media, Spin to Win! pages 10-11
A paperclip
Classmates
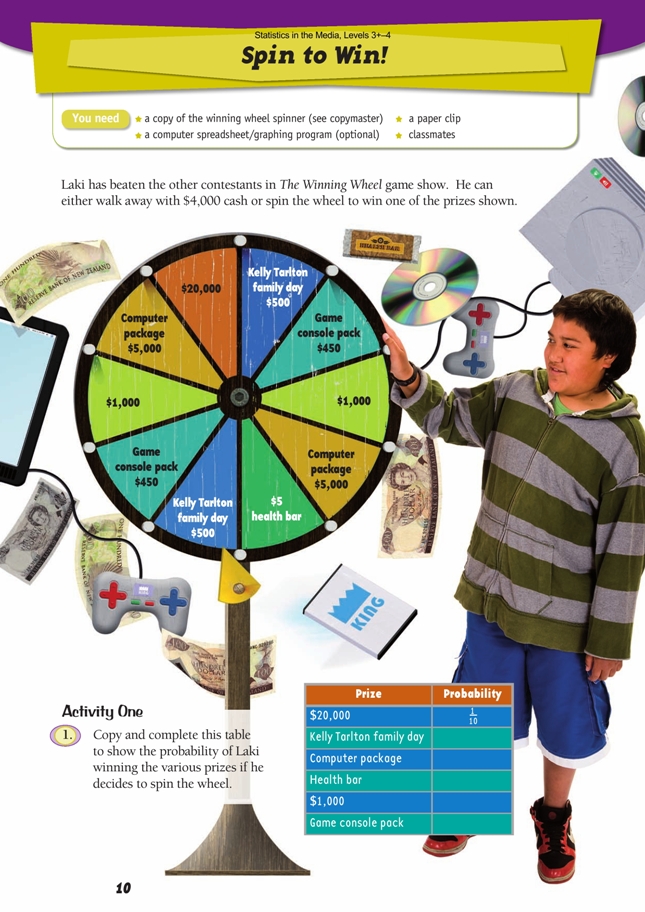
Activity One
All sectors of the circle are equal, so the chance of the spinner landing in any sector is 1 out of 10. However, some prizes occur in two sectors, so the chance of winning these prizes is 2 out of 10 or 1/5.
Possible reasoning for question 2 is given in the Answers. Although students at this level would not be required to find “expected values”, this is how you would find the expected value in this instance: multiply each probability with its prize value and then add the results together. In this
situation, it is: 1/10 x $20,000 + 1/5 x $500 + 1/5 x $5,000 + 1/10 x $5 + 1/5 x $1,000 + 1/5 x $450 = $2,000 + $100 + $1,000 + 50c + $200 + $90 = $3,390.50. This indicates that taking the guaranteed cash prize of $4,000 is likely to be a better choice because it is higher than the expected value of $3,390.50. Furthermore, there is only a 3/10 chance of getting a prize valued higher than the
$4,000 cash amount.
Question 3 focuses on common misconceptions. You could explore this with the students by considering multiple coin tosses. Many people think that if there have been a large number of heads, then the next toss is bound to be tails. It isn’t. Heads or tails are still a 50–50 chance (unless the coin is biased) because each toss is independent of the previous tosses.
Activity Two
In relation to question 1, it may be interesting for students to note that if every contestant spun the wheel and won the $20,000, then the season (10 shows) would cost $200,000. The chance of this happening is extremely low because a contestant’s chance of winning $20,000 on a spin is 1 out of 10 or and the chance of $20,000 being won in all 10 episodes is 1/10 x 1/10 x 1/10 x 1/10 x 1/10 x 1/10 x 1/10 x 1/10 x 1/10 x or (1/10)10. This equals 1 chance in 10 000 000 000 (or one chance in ten billion), which is a very slim chance indeed! (The chance of no one winning the jackpot of $20,000 over the course of a season is [9/10 ]10, which is 0.35 or 35%.)
Although the cost for the season if everyone spun the wheel is somewhere between $50 (the cost of 10 health bars) and $200,000, the “expected cost” is $33,905, based on the assumption that each of the equally likely outcomes occurs once (see the Answers section and the notes for Activity One).
By simulating a number of seasons with the whole class (that is, everyone spinning a paper clip around the wheel 10 times and recording prize values), you will generate results for 20 to 30 seasons. This is not quite enough to fi nd an average that will approximate the likely winnings. The greater the number of seasons simulated, the closer the results will be to the expected value of $33,905. 100 seasons would be better; perhaps the students could do 4 seasons each, find the mean, and then combine with the rest of the class to get an overall mean.
Activity Three
In question 1, students investigate a simulated season. Better results may be achieved if the decision to spin or take the cash is based on the toss of a coin, thus avoiding prejudiced decisions based on earlier results. (To spin the wheel, have the students position the tip of a pen or pencil in the middle of the wheel and spin a paper clip around it with their fingers.)
Combining data with that of other classmates is sound practice. In this case, the greater the number of classmates involved, the closer the result will be to $36,952.50 (calculated as x $33,905 + x $40,000, assuming a 50–50 chance of spinning or taking the cash). Encourage the students to aim for 100 simulated seasons as a basis for discussion.
The following table shows the results of a computer simulation of 10 seasons of The Winning Wheel, based on the assumption that, in every show, the winning contestant chooses to spin the wheel. You may like to give your students a photocopy of this information to analyse. They will be able to see that every season is completely different from every other one (and would be even more so if the $4,000 was chosen in some episodes). They will also be able to calculate how many times the different prizes come up and what the total cost of prizes was for each season. They can compare these outcomes with what would have happened if each contestant took the
$4,000. The students could add up the prize money for each of the 10 seasons, put them on a dot plot, and observe features such as: the centre (is it near $33,905?), the spread (skewed? Are there outliers?), and the top and bottom totals.
Note that the numbers 1–10 represent the 10 sectors of the board; working around the board clockwise from “12 o’clock”: 1 is the Kelly Tarlton family day, 2 is the game console, 3 is the $1,000, and so on.
For question 3, see the comments in the answers for a discussion about profi ts versus advertising revenue.
Answers to Activities
Activity One
1.
2. Answers will vary. If Laki wants a guaranteed prize worth more than $1,000, he should take the $4,000. Taking into account that some prizes are on 2 sectors of the wheel, there are more prizes below $4,000 than above that amount. Laki has 3 chances in 10 of winning a prize of more than $4,000 and 7 chances in 10 of winning one valued at less than $4,000.
The table below shows the probability of winning each prize compared with the $4,000 cash.
3. What has happened previously makes no difference to what happens next because spins are all independent of each other. (This means that it is possible, for example, for a 1-in-100 event to happen twice or more in a row!)
Activity Two
1. a. $40,000
b. 67% ( 40000/60000)
2. The cost would vary from season to season. It could be as little as $50 for 10 health bars or as much as $200,000 for 10 x $20,000; in the latter case, the show would make a big loss! (Sometimes, games show promoters take out
insurance against worst-case scenarios.) The reality is likely to be somewhere in between, with the probable value of prizes being less than the season’s $60,000 budget.
The table below shows what the cost would be if no one chose the $4,000 and each sector of the wheel came up once during the season:
Activity Three
1. a. Results will vary. For example:
b. Results will vary. The cost for the example given is $42,455.
2. a. No. It will be different every time, depending on the spins. However, over
time, the producers would be able to get a fair idea of the likely cost per season.
b. Graphs will vary, but the combined results should give some idea of what
expenditure the producers could expect from season to season. (This would be
even more apparent if the data was from 100 or more seasons.)
3. Answers will vary. If contestants take the money each time, the cost would be $40,000 for a season. If all or most contestants spin the wheel, the value of prizes for 1 season, unless the $20,000 comes up more than once, will probably be a bit more or a bit less than $40,000 (see the table in the answers for Activity Two, question 2). However, the probability is that seven-tenths of spins (see Activity One, question 2) will win less than $4,000, so it may be fi nancially better for the show’s host to encourage contestants to spin the wheel.
Ratings and advertising revenue are also a factor. Audiences enjoy watching contestants taking a risk, especially if the risk “pays off” and the spinner wins a good prize (or possibly, if the person seems “greedy”, the audience are pleased if the spin results in a low prize!), but they are also pleased when a cash prize of $4,000 is given out instead of a health bar or a lower value prize. However, if everyone took the $4,000 cash instead of spinning the wheel, viewers might lose interest and the audience numbers might drop, and that would affect advertising revenue.
Key Competencies
Spin to Win! can be used to develop these key competencies:
• thinking: investigating, making decisions, designing investigations
• using language, symbols, and texts: communicating findings
• managing self: working independently, seeking understanding.