This is a level 3 statistics activity from the Figure It Out series.
A PDF of the student activity is included.
Click on the image to enlarge it. Click again to close. Download PDF (1687 KB)
construct a tally chart
investigate a game of chance
compare tally charts with others
This diagram shows the areas of Statistics involved in this activity.
The bottom half of the diagram represents the 5 stages of the PPDAC (Problem, Plan, Data, Analysis, Conclusion) statistics investigation cycle.
A counter and dice
Tally charts copymaster
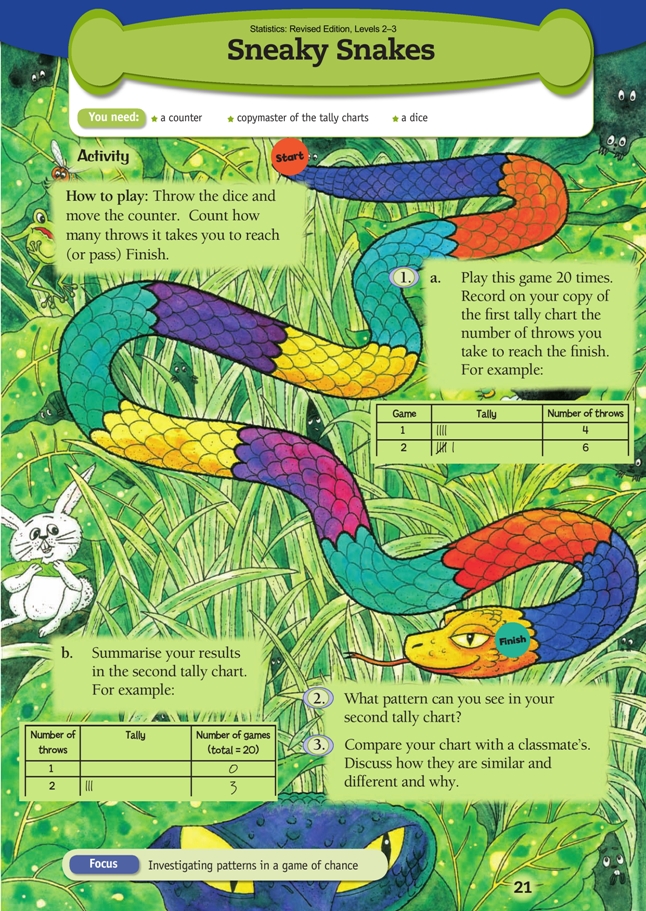
This activity involves the students playing a simple game of chance a minimum of 20 times. Using a tally chart (see copymaster), they record the number of throws of the dice it takes to complete each game. They then summarise their data in a second tally chart.
Before they start playing the game, challenge the students to think about these questions:
• What is the least number of throws it could take to complete a game? (2)
• What is the maximum number of throws it could take to complete a game? (12)
After they have played a few games, challenge the students to think about these questions:
• Which numbers of throws (between 2 and 12) are likely to be very rare events? (7 or more)
• How many throws will it take to complete most games? (3 to 5)
When the students have played the suggested 20 games, they summarise the outcomes in the second tally chart. This will almost certainly reveal that nearly all games are completed in 3 to 5 throws. If a number of groups are playing the game, they can pool their data and then see if the collated results confirm this pattern.
The second tally chart might look like this when completed:
For your information, a computer simulation of 100 games produced this data:
The distribution of the data in this table is likely to be typical.
Encourage the students to try and explain the pattern they have found. They might say:
• “There are lots of ways to get 10 or over with three, four, or five throws.”
• “If you get a low number fi rst, you often get a high number next, and that gives you about 6 or 7 from two throws.”
• “To take more than fi ve throws, you have to get mostly ones or twos, and it’s not often you get a run of ones or twos.”
Students who are ready for a challenge could probe a bit deeper. They could start by recognising that, for a game to take 12 moves, they would need to get 11 ones (no matter what the 12th number is, the game fi nishes at that point). If just one of those 11 throws is a 2, not a 1, the game would finish in 11 moves, and if just one of those throws is a 3 (or two are 2s), the game would finish in 10 moves … Such sequences are likely to be very rare indeed.
Answers to Activity
1.–3. Results and discussion will vary.
Key Competencies
Sneaky Snakes can be used to develop these key competencies:
• thinking
• using language, symbols, and texts.