This is a level 4 algebra strand activity from the Figure It Out series.
A PDF of the student activity is included.
Click on the image to enlarge it. Click again to close. Download PDF (550 KB)
use a graph or a table to show a relationship
equipment for each investigation (see students' booklet)
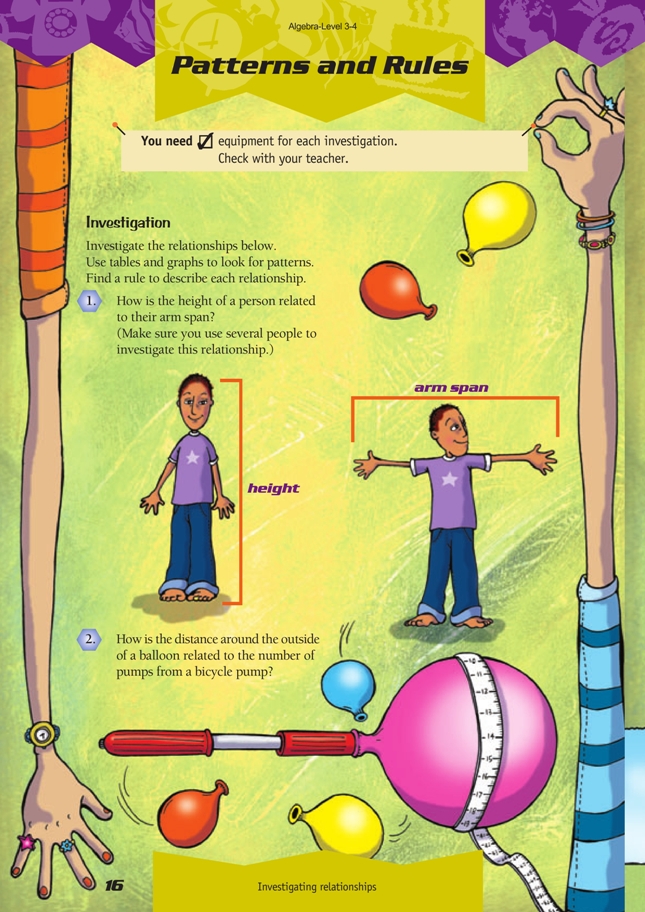
Investigation
These activities provide opportunities for students to apply their understanding of algebraic relationships to measurement. As measurement data always contains some error, the conclusions that the students come up with will be approximations and should express trends in the data rather than exact rules.
The students can express the data from each investigation in both table and graph forms, which will help them to see the patterns. The graphs will show that some of these relationships are linear and some are not.
Consider investigation 1. Here are some hypothetical results:
The data in the table shows that the heights of the people surveyed were close to their arm spans. This trend is confirmed in the graph because the points lie in a rough line.
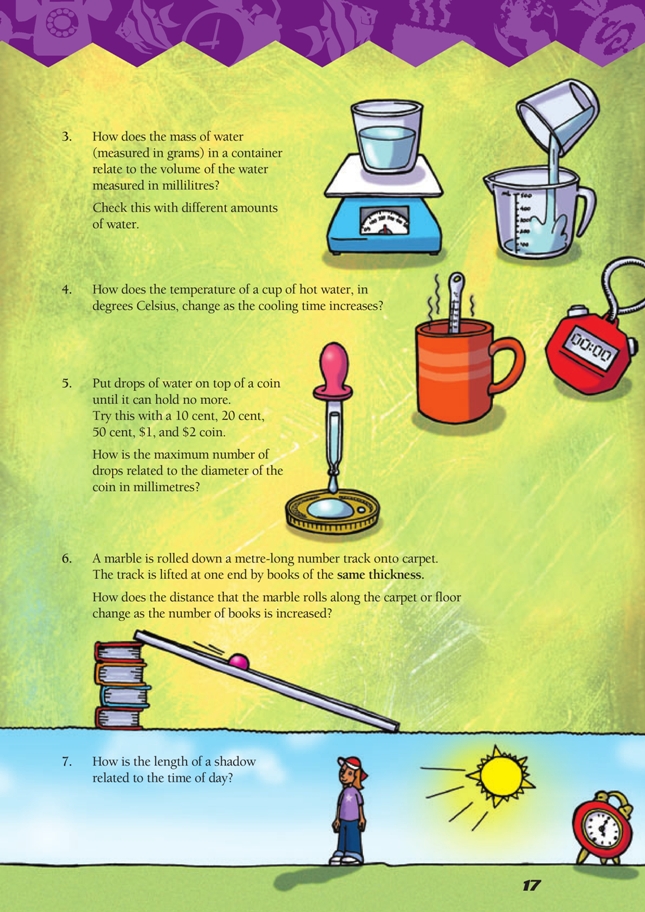
In investigation 3, a similar linear relationship exists between the volume of an amount of water and its mass. The mass of 1 millilitre of water is 1 gram. Although the inaccuracy of both the students’ measurement techniques and the devices they use will create errors, there should be general trends in the data. (For this investigation, the scales will need to be accurate to 1 gram.)
Some of the other investigations will produce non-linear relationships. Examples of these are shown below:
The circumference of the balloon should flatten out as the increased air pressure results in each pump having less effect. This is also due to the volume of the balloon being three-dimensional while the circumference measures twodimensionally.
The fact that air compresses is also significant. As the balloon gets tighter, the
air within it compresses more until the skin of the balloon cannot stand the pressure and it bursts. (This compression accounts to a large degree for the drop in the rate of increase of the circumference. You would get a different result if you filled the balloon with water.)
Initially the temperature of hot water cools rapidly, but the rate of cooling flattens out as it nears room temperature. This is because the rate of cooling is related to the difference between the water temperature and the air temperature.
Shadows are longest at the start and end of the day when the sun is lowest in the sky.
They get shortest about midday (or 1 p.m. during daylight saving) when the sun is
highest.
Answers to Activity
Investigation
Conclusions will vary. (There are suggestions in the teachers’ notes.)