This is a level 5 statistics activity from the Figure It Out theme series.
A PDF of the student activity is available.
Click on the image to enlarge it. Click again to close. Download PDF (408 KB)
fomd the median from a data set
fidn the mode from a data set
A computer spreadsheet
FIO, Levels 3-4, Theme: Moving House, Moving Survey, pages 22-23
A classmate
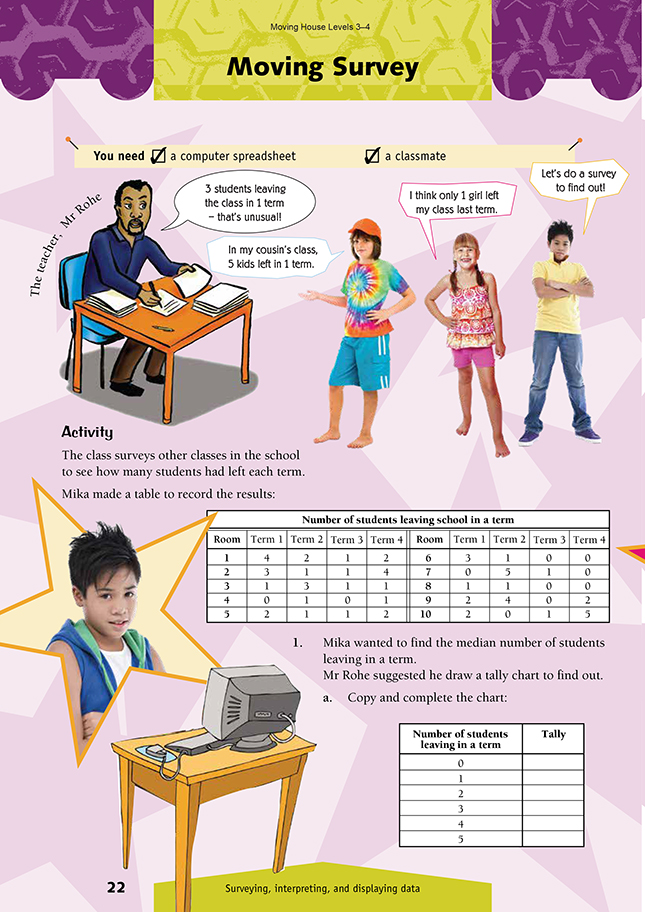
This activity begins with the assertion “3 students leaving the class in 1 term – that’s unusual!” and some data that might or might not support the assertion. The students then analyse the data using different tools (a tally chart, a bar graph, and the median, mode and mean) and conclude by saying whether they agree with the original assertion. The activity is an opportunity to emphasise that unsorted, unprocessed data (such as in the first table) is little help in reaching a conclusion. Analysis is the process by which data is sorted, measured, and presented in a useful way.
A useful starting point is the statement itself, which needs clarification. By “3”, does Mr Rohe mean “3 or more”? (Yes.) Then ask the students if they can conclude anything from looking at the raw data on page 22. Ask them to suggest what they could do with this data to help work out whether Mr Rohe’s statement is right. The questions then guide them through a series of steps that should enable them to reach an informed conclusion.
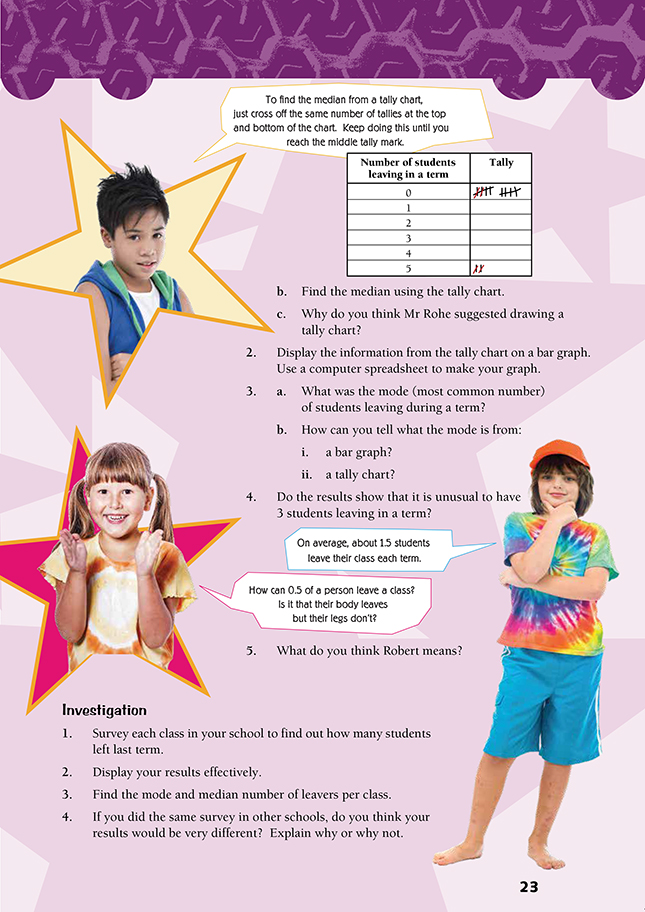
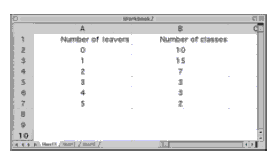
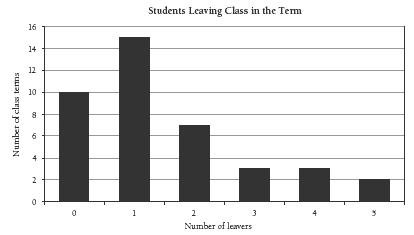
Question 1 asks the students to make a tally chart. If they have not been introduced to tally marks, this very useful technique will need to be explained, especially the grouping in fives for easy counting, as illustrated in the second diagram. Question 2 asks the students to use a spreadsheet to make a bar graph. It should look like this:
In question 3, the mode can easily be found from either the bar graph or the tally chart – just look for the tallest bar or the line with the most tallies.
Once they have crunched the numbers, question 4 asks the students to decide whether they support the original assertion that it is unusual for 3 (or more) students to leave from a class in a term. In fact, this happened 8 times out of 40. The students can discuss whether something that happens 20 percent of the time should be called unusual. Statisticians would say that it should not. Three students leaving in a term is not particularly common, but neither is it unusual. If students are still uncertain about this, ask if they think it is “unusual” to be left-handed. It is estimated that about
one in seven people are left-handed, but this does not make left-handedness unusual.
Question 5 asks what it means when the average of whole-number (discrete) data is not itself a whole number. The students need to see that there is meaning to this concept even if there is no such thing in reality. The average of the two whole numbers 8 and 9 cannot itself be expressed by a whole number, but this does not stop us usefully defining the middle ground (average) with the fraction 8.5. You could ask the students to check Robert’s calculation of the mean: 60 students leave over 40 term equivalents, which is exactly 1.5 students per term.
Investigation
Assigning one student to collect the data from each class is the most efficient way to start this investigation. This will provide quite a pool of data that can then be graphed and analysed as suggested. It could be interesting to break the data down by, say, gender or year level. Different groups within your class could analyse the data, checking for the influence of different factors. The answer to question 4 needs to be “yes”; some schools have considerably higher rates of transfer than others. It will be interesting to hear the reasons students come up with for this fact.
Links
This activity and the following one could form part of a unit on Changes.
Suggested achievement objectives are:
Health and Physical Education
• identify factors that affect personal, physical, social, and emotional growth and develop skills to manage changes (Personal Health and Physical Development, level 3)
• identify and compare ways of establishing relationships and managing changing relationships (Relationships with Other People, level 3)
• identify the effects of changing situations, roles and responsibilities on relationships and describe appropriate responses (Relationships with Other People, level 4).
Because this topic is a sensitive one, teachers should make themselves familiar with the Ministry of Education’s safety guidelines. These are found in Change, Loss, and Grief, in the series The Curriculum in Action.
Answers to Activity
1. a.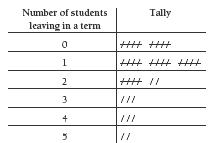
b. The median is 1 student leaving per term.
c. A tally chart is a quick and easy way of sorting and counting the data, and the median can easily be found from it.
2.
3. a. 1
b. i. The mode is the tallest bar.
ii. The mode has the most tallies.
4. 3 leaving a class in a term is not particularly common, but neither is it unusual. Data was collected from 10 classes; this represented a total of 40 school terms. In 8 out of those 40 terms, 3 or more students left.
5. Statistically, there is no problem with talking about 1.5 people even though common sense tells us that you cannot have half a person. The “average” is a mathematical idea designed to help make sense of lots of bits of data. It is rare for it
to be a whole number.
Investigation
1.–3. Answers will vary. Teacher to check
4. Whatever your result, there will be schools that would produce quite a different result from a similar survey. Reasons for a high rate of transfer could be:
• a lot of rental housing in the community
• recent closure of a major industry
• lack of employment opportunities in the area
• students shifting to a more popular school