This unit provides students with the opportunity to explore concepts of probability in the context of a fun game - Greedy Pig.
- Calculate the probabilities for outcomes of a dice roll.
- Draw a dot plot of results.
- Interpret dot plots in terms of centre and variation.
- Calculate averages and expected values.
The mathematics in this unit is at the higher end of Level 4/start of Level 5, but should be manageable for students at Level 4 with support from the teacher. Students will need to understand how to use powers of numbers in practical situations, and how to draw and interpret probability trees. This unit investigates expected outcomes of probability events, in the practical context of the game Greedy Pig.
The learning opportunities in this unit can be differentiated by providing or removing support to students and by varying the task requirements. Ways to differentiate include:
- playing a simpler game such as rolling two dice and finding the sum
- grouping students flexibly to encourage peer learning, scaffolding, extension, and the sharing and questioning of ideas
- modelling the construction of tables and graphs
- apply the gradual release of responsibility to scaffold students towards working independently
- providing frequent opportunities for students to share their thinking and strategies, ask questions, collaborate, and clarify in a range of whole-class, small-group, peer-peer, and teacher-student settings
- working more with experimental results progressing to theoretical probability
- providing supportive technology such as graphing tools and online applets to carry out experiments.
The context for this unit is a single dice game that involves elements of chance. The theoretical probability is challenging at this level so you may decide on simpler contexts for exploring tree diagrams and expressing probabilities as fractions. For example, you might explore other chance situations that are familiar to students, such as tossing a coin to start a sports game, or investigate real-life situations that involve elements of chance, such as the weather forecast, traffic lights, or prize packs
Te reo Māori kupu such as tūponotanga (chance, probability), kauwhata ira (dot plot), toharite (average), hoahoa rākau (tree diagram), and taurangirangi (variation) could be introduced in this unit and used throughout other mathematical learning.
- paper and pencils for recording
- dice
Session 1
In this introductory session we introduce the game of Greedy Pig and play it several times to give students a chance to identify some possible strategies.
- Introduce the game of Greedy Pig and explain the rules.
Greedy Pig- To play this game you need an ordinary 6-sided die.
- Each round of the game consists of one or more rolls of the die. You keep rolling until you decide to stop, or until you roll a 1. You may choose to stop at any time.
- If you choose to stop rolling before you roll a 1, your score is the sum of all the numbers you rolled on that turn.
- If you roll a 1, your score for that turn is 0.
- The player with the highest score, after ten rounds, wins.
- Ensure that students understand the rules.
- Play the game a few times so that students see how it works. Then play ten rounds either as a whole class with the teacher rolling the dice or in groups with a student being the dice roller.
- Ask students to describe how they decide when to save their score. Ask them to justify why they use their strategy for maximising the score. These strategies might include staying in each round for a certain number of rolls or waiting until a total score is reached.
- List some of the possible strategies.
- Compare the relative success of the strategies and why students think they are successful.
Session 2
In this session we investigate some of the strategies to see why they are successful, or not.
- Play a couple of games of Greedy Pig as a class, with students using whatever strategy they prefer. Ask students to keep their score carefully for each round so you can collect the data.
- Explain that we are going to try to find out what strategy will give the highest score.
- Ensure that all strategies are clear so everyone using that strategy plays the same., e.g., that anyone using that strategy would play the same. It is likely that most students will choose strategies based around either numbers of rolls (e.g., Stay in until there have been 4 rolls and then save your score) or around obtaining a total for the turn (e.g.,Stay in until you have 15 points and then save your score).
- Explain to students that they are going to record the total for each round rather than just the total for each game, as the best strategy should give the best average score for turns in the long run.
- Play 20 rounds asking each student to keep track of their score for each turn.
- Compare results.
Who has scored the most for the 20 turns?
What strategy did they use? What was their average score per turn?
You may need to discuss the term average and how it is calculated. - Ask all students to work out their own average score per turn.
- You might ask students to record their points per round using a dot plot. Each dot represents the score for a single round. The dot plot below was created with Desmos.
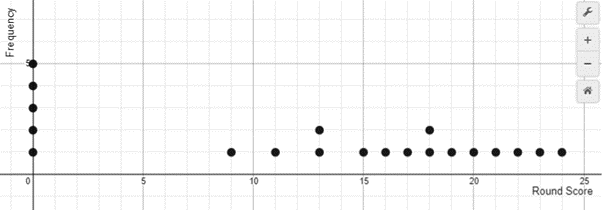
- Discuss why some strategies are better than others.
Sessions 3-4
In these two sessions we try to find the best number of rolls of the die to remain in the game by experimentation and by theoretical probability. Some students might work out the theoretical probability themselves but that is quite challenging at this level. Most students will need scaffolded support.
Trying a ‘number of rolls’ strategy.
- Play 20 rounds of Greedy Pig. Assign each group of 3-4 students a set number of rolls of the die to remain in each round. One group may quit a round after one roll, another group after two rolls, etc.
- Ask each group to create a dot plot showing their score each round.
- For example, a dot plot of taking a single roll before quitting might look like this:
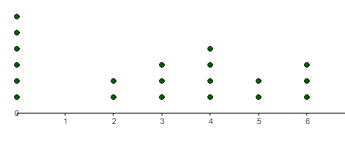
- Discuss whether the ‘one throw’ strategy worked well. In this case there were more than an expected number of ones thrown.
Out of 20 tosses how many ones would you expect to get?
This will lead to a discussion that there are six numbers on the dice and each number has a one sixth chance of being thrown. Since one sixth of 20 is about three then you might expect to see three or four of each number come up. However, there is a lot of variation in sets of 20 dice throws. - Compare the success of staying with different numbers of rolls.
Which was most successful strategy? Why do you think it was the most successful? - Look for students to explain a balance between gathering points and the risk of losing all the points.
What was the average number of points per round for your strategy? (Remember to include the zeroes when calculating averages.) - Compare the variation in the dot plots as well.
Which strategy produces the most variation?
Which strategy produces the least variation?
Students might notice that larger numbers of rolls produce more variation because the scores for each round are higher or alternatively are zero. - Ask students whether they can tell you for certain what the best number of rolls to stay in for is. Hopefully they will realise that with only 10 turns tested, they cannot know for sure which number of rolls will be most successful in the long run. The data of one trial is not sufficient. You can look at variation in trail results by staying with the same strategy over many ten round games. The totals will vary.
- Ask for suggestions as to how you could find the best number of rolls to stay in for.
- Try a larger sample size. Look for a Greedy Pig simulator online to speed up the data collection.
Try playing 20 or 30 turns with students trying the strategy of staying in for numbers of rolls within this range. Students may see that they need to stay in for at least three rolls before they get good scores and will also have noticed that staying in for more than around 8 rolls is likely to result in almost all zero scores. - Discuss the results. Ask students whether they now know for certain what is the best number of rolls to stay in for. In general, if there is enough data, 5 or 6 rolls maximises the scores.
Exploring the best number of rolls theoretically.
- The mathematics involved is quite complicated for Level 4 students, but you can scaffold the approach as follows:
How many points do you score on a single roll? - Students will note that scores of 0, 2, 3, 4, 5, and 6 are possible.
What is the average for a point scoring roll?
Since 0 + 2 + 3 + 4 + 5 + 6 = 20 and 20 ÷ 6 = 3 1/3 there is an average of three and one third points scored on a successful roll. - How does this work for staying in for more than one roll?
If you elect to stay in for two rolls, there is still a 1/6 chance that you will roll a 1 on the first roll, in which case your total score for the turn is 0. There is also a 1/6 chance that you will roll a 1 on the second roll, in which case your total score is 0. Maybe it would help to draw a probability tree of this. A probability tree with all 6 possible outcomes (1-6 on the die) will get too big very quickly, so let's just look at the possibilities, which are getting a 1, or not getting a 1. This will at least help us work out the probability of getting a total score of 0.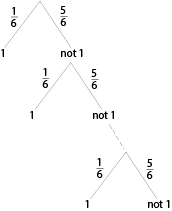
- So how do we work out the probability of getting 0 from this?
Hopefully students will be able to see that for any given number of rolls there is a (5/6)n chance of getting a score, as all the other branches end in 1, or a score of 0. Therefore, for any given number of rolls, there is a 1 - (5/6)n chance of getting 0.
This is useful, at least we know what the chance of scoring nothing is for any chosen number of rolls, and we can see that the chance of getting 0 goes up the more rolls we stay in for. But the more rolls we stay in for the more points we will score if we don’t roll a 1.
How can we work out how much we are likely to score?
If we do not roll a 1, there are five possibilities, each of which will add to our score.
What is the average gain from these possibilities?
This can be found by simply averaging the five values. (2+3+4+5+6)/5 = 4. So, if we don’t roll a 1 and lose our whole score, we will on average gain 4 points per roll.
Applying this new knowledge to the probability tree above tells us that for any given number of rolls chosen we have a 1 - (5/6)n chance of getting 0 and a (5/6)n chance of getting a score, which will on average be 4n.
So the expected score for n rolls is (1 - (5/6)n)x0 + ((5/6)n) x 4n
And since (1 - (5/6)n)x0 = 0 we can simplify this to:
The expected score for n rolls is (5/6)n x 4n.
- Have students make a table of the expected scores for using a strategy of staying in the game for 1 – 10 rolls (you could use Excel or similar if you wish).
| Number of rolls | Chance of scoring | Score | Expected total score |
| n | (5/6)n | 4n | (5/6)n x 4n |
| 1 | 0.83 | 4 | 3.33 |
| 2 | 0.69 | 8 | 5.56 |
| 3 | 0.58 | 12 | 6.94 |
| 4 | 0.48 | 16 | 7.72 |
| 5 | 0.40 | 20 | 8.04 |
| 6 | 0.33 | 24 | 8.04 |
| 7 | 0.28 | 28 | 7.81 |
| 8 | 0.23 | 32 | 7.44 |
| 9 | 0.19 | 36 | 6.98 |
| 10 | 0.16 | 40 | 6.46 |
Note: All values to 2 decimal places.
Therefore, if you are going to adopt a strategy of staying in for the same number of rolls each turn, you should stay in for either 5 or 6, in which case you will get an average score of just over 8 per turn.
- Discuss problems associated with adopting a strategy of staying in for a certain number of rolls. The biggest problem with this strategy is that if you roll 4 sixes in a row you are obliged to roll again and risk your score of 24, and conversely, if you roll five twos in a row you should stop on only 10 for the turn.
Session 5.
In today’s session we look at the alternative strategy of choosing a certain target score and stopping if you reach it on any given turn.
- Play a game of Greedy Pig, with students choosing a target total for each turn. (e.g. Stay in a round until you have 15 points and then save your score)
- Compare the success of different target totals.
Which target number was most successful?
How much did each number score on average? (Remember to include the zeroes when calculating averages.) - Is enough data to predict the best target total?
- Hopefully they will realise that with only 10 turns tested they cannot know for sure which target total will be most successful in the long run. They will probably have realised that they should stay in until they have at least 10, but that 25 is too good a score to risk.
- How can we find what scores you should remain in on, and which you should ‘bank’?
Students might suggest gathering more data using an online tool or thinking about the problem theoretically.
Exploring the problem theoretically
- Look at the two possibilities: either we roll a 1 and lose our whole score, or we roll a different number in which case we expect to gain on average 4 points.
On average, what score might you expect on the first throw?
There is a 1/6 chance that we will roll a 1 and get 0, and a 5/6 chance that we will get more points (an average of 4), so the expected outcome is (1/6 x 0)+(5/6 x 4) = 3.33. - Imagine that the game has gone on for a few throws and you have a score of 15.
What might happen next throw?
Students should comment that the dice can land on 2, 3, 4, 5 or 6 and you will add that total to your score. Alternatively, one could be thrown, and you lose the lot.
We need to balance the amount we might gain with the risk of losing the lot.
How might we do that?
If the score is 15, what chance do we have of losing all our points on the next turn? (1/6)
There is a 1/6 chance that the result is -15.
If the score is 15, what are the chances of adding to our score? (5/6)
On average what total might we expect to add to our scored?
Since the average of 2, 3, 4, 5, and 6 is 4 we have an expected gain of 5/6 x (15 + 4). Note that 15 + 4 is the current score plus the average we might expect given the chance of getting a number other than one. - Ask students to create a spreadsheet of the expected total as below:
| Total | Total if 1 not rolled | Expected total |
| n | n+4 | 5/6(n+4) |
| 10 | 14 | 11.67 |
| 11 | 15 | 12.50 |
| 12 | 16 | 13.33 |
| 13 | 17 | 14.17 |
| 14 | 18 | 15.00 |
| 15 | 19 | 15.83 |
| 16 | 20 | 16.67 |
| 17 | 21 | 17.50 |
| 18 | 22 | 18.33 |
| 19 | 23 | 19.17 |
| 20 | 24 | 20.00 |
| 21 | 25 | 20.83 |
| 22 | 26 | 21.67 |
| 23 | 27 | 22.50 |
| 24 | 28 | 23.33 |
| 25 | 29 | 24.17 |
Note: All values to 2 decimal places
- Ask students to explain what this spreadsheet tells us.
They may notice the expected totals keep going up. However, once they reach 20, the expected total for rolling again is lower than the score if they save their score where they are. Therefore, if your score is less than 20 you should roll again, but if it is more than 20 you should save your score.
What is the best strategy for playing Greedy Pig?
- Discuss whether choosing a number of rolls before quitting or choosing a target total before quitting is a better strategy. The better strategy over the long run is choosing a target total, as this strategy adapts depending on the results of each roll. For example, stopping after six rolls if you have only rolled low numbers and have a total of 10 is not a good idea.
Dear families and whānau,
Recently we have been investigating the best strategy for playing a game called Greedy Pig. Ask your child to teach you this game. See how many strategies you can come up with, and ask your child to explain what they think the best strategy is.