This is a level 4 number link activity from the Figure It Out series. It relates to Stage 7 of the Number Framework.
A PDF of the student activity is included.
Click on the image to enlarge it. Click again to close. Download PDF (221 KB)
order decimals to 3 decimal places
add and subtract decimals
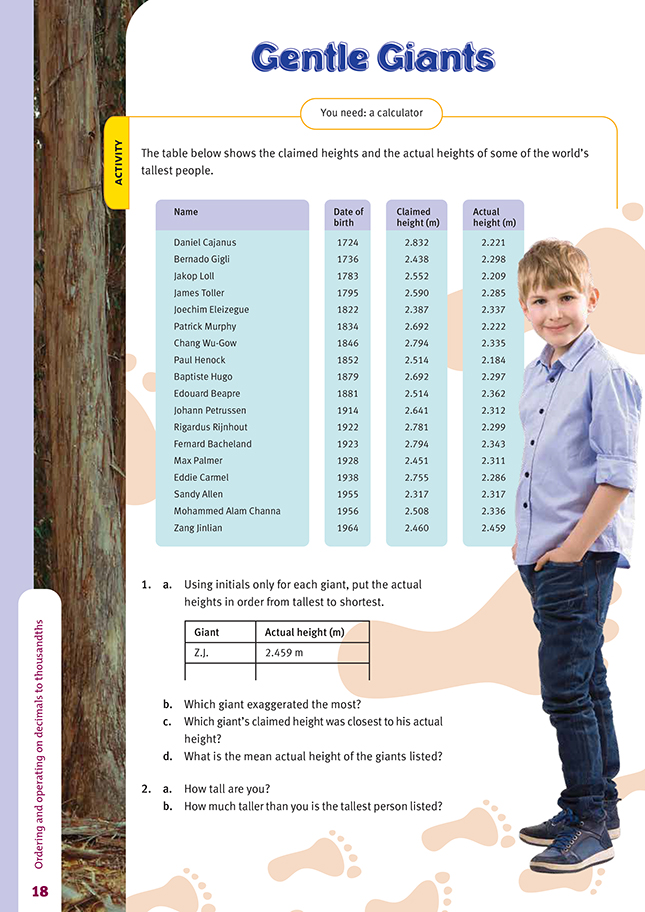
FIO, Link, Number, Book Five, Gentle Giants, page 18
A calculator
For question 1, the students will need to know how to order decimals and also how to find the difference between two decimal numbers (in this case, the claimed and actual heights).
The students could measure out on the classroom wall the actual heights of the tallest and shortest giants (Zang Jinlian and Paul Hencock respectively). They would then need consider what the “.459 metres” part of Zang Jinlian’s height means and what the “.184 metres” part of Paul Hencock’s height means.
As an extension, you could ask the students to display the data on a stem-and-leaf graph or on a box-and-whisker graph. They could use their graphs to find the median, compare this to the mean, and consider why the two differ.
Stem-and-leaf graph:
The median here works out at 2.305. It is halfway between 2.299 and 2.311, the two middle scores.
Box-and-whisker graph:
The box-and-whisker graph shows that the giants range in height from 2.184 metres to 2.459 metres and that the height of the 50 percent of giants between the lower quartile and the upper quartile is within the range 2.285 metres to 2.336 metres, a range of just 51 millimetres (or 5.1 centimetres). The other advantage in constructing a box-and-whisker graph is that it requires the students to consider in some depth what heights such as 2.285 metres, 2.305 metres, and 2.336 metres mean in order to locate them on the metre number line.
A possible extension of question 2 is to investigate the mean height of the students in the class, how this differs from the median height, why the median may be a more useful indicator of the average height (it is not affected by extremes [outliers] in the way that a mean score is), and the range of heights for the 50 percent of students who lie between the lower and upper quartiles.
Answers to Activity
1. a.
b. Daniel Cajanus
c. Sandy Allen. (His claimed height and his actual height are the same.)
d. 2.301 m (to 3 d.p.)
2. a.–b. Answers will vary.