This is a level 4 statistics activity from the Figure It Out series.
A PDF of the student activity is included.
Click on the image to enlarge it. Click again to close. Download PDF (1187 KB)
This diagram shows the areas of Statistics involved in this activity.
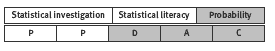
The bottom half of the diagram represents the 5 stages of the PPDAC (Problem, Plan, Data, Analysis, Conclusion) statistics investigation cycle.
Statistical Ideas
Free CD! involves probability, simulations, probability misconceptions, and using statistical graphs.
FIO, Levels 4 -4+, Statistics in the Media, Free CD! pages 18-19
A copy of the charts (see copymaster)
30 coloured beans (10 colour A, 20 colour B)
Classmates
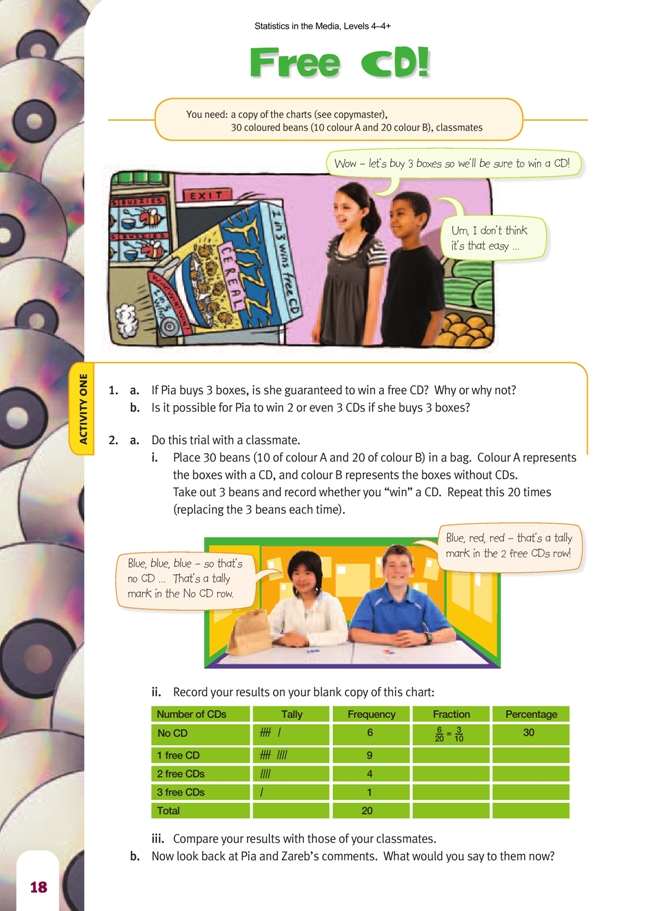
Activity One
Simulations such as the one in this activity can be a good way to challenge students’ assumptions about probability. However, the simulations do need to provide a good representation of the actual situation and be understood by the students. In this case, the key is to ensure that the students understand that the counters represent cereal boxes and that 1 counter in 3 is a different colour to represent the boxes with CDs in them.
Note that this simulation is not perfect because each bean is taken from the bag and not replaced until all 3 beans are selected, so the probabilities for the next selection change slightly: the probability that the first bean will be colour A is 10/30 ≈ 0.33; for the second (assuming the first was colour A), it is 9/21 ≈ 0.31; and for the third
(assuming the first two are colour A), 8/28 ≈ 0.29.
A simple, more accurate simulation involves the use of a standard dice. Let the numbers 1 and 2 represent a box with a CD and the numbers 3 to 6 a box without a CD. Rolling the dice represents purchasing a box of cereal. Three rolls of the dice (or 1 roll of 3 dice) models the purchase of 3 boxes of cereal, as in question 2.
Another simulation involves the use of the random number function (Ran#) that can be found on most scientific calculators. Have the students initiate the random function and then keep pressing the = key; they will find that they obtain a series of random numbers between 0 and 1, usually to 3 decimal places. For the purpose of this
simulation, they can ignore all but the digit after the decimal point. If this digit is {1, 2, 3}, it represents a box with a CD; if it is {4, 5, 6, 7, 8, 9}, it represents a box without a CD. If the digit is 0, they should ignore it. Here are 30 numbers generated in this way. Each column represents a trial (in this case, the purchase of 3 boxes of cereal). Each shaded cell represents a box containing a CD:
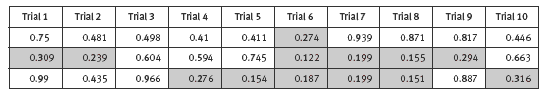
It can be seen that 1 trial (column 6) produced 3 CDs, 2 trials (columns 7 and 8) produced 2 CDs, 6 trials produced a single CD, and only 1 trial (column 3) produced 0 CDs. Overall, of the boxes contained CDs and of the trials produced at least 1 CD.
By pooling their results, the students will be able to approximate the theoretical probabilities for this experiment. (For your information, approximate percentages for these are: No CDs ≈ 30%; 1 CD ≈ 44%; 2 CDs ≈ 22%; 3 CDs ≈ 4%.)
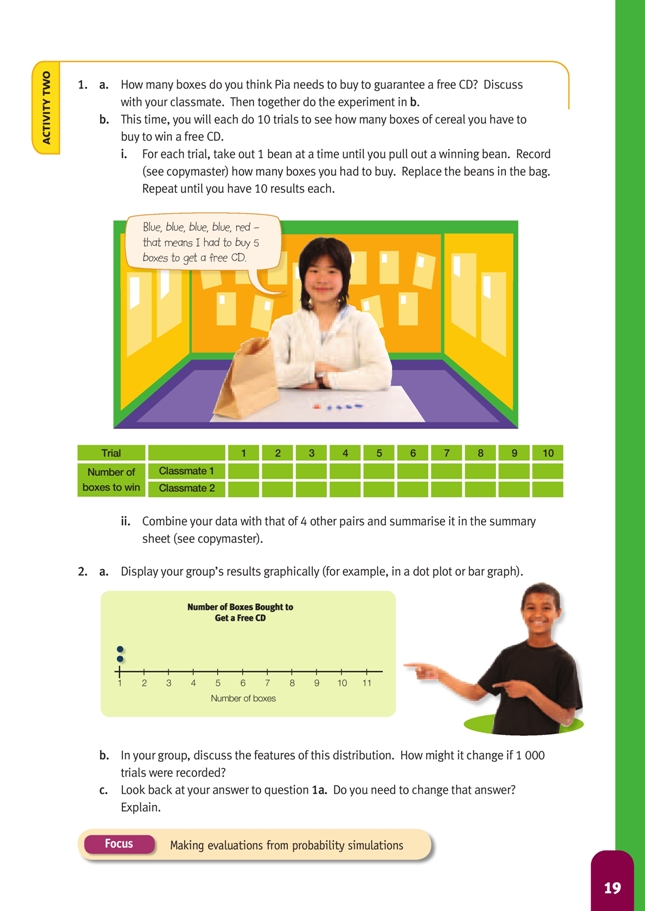
Activity Two
By the end of question 1, the students should have data from 100 trials to display and discuss. As in the previous activity, a simulation involving dice or random numbers can be used instead of beans. This time, if the students are generating the random numbers on the calculator, have them write down all the non-zero digits. Each 1–3 digit represents a box with a CD in it (a “win”). Mark off the sequences of digits that end in “wins”. Here is the sequence obtained from one simulation (each trial stops as soon as a CD is found):
75481 / 49841 / 41 / 1/ / 2/ 7493 / 9871 / 81 / 74463 / 92 / 3 / 9645947451 / 2 / 2 / 1 / 991 / 552 / 94663 /99943 / 59662 / 761 / 541 / 871 / 991 / 1 / 8873 / 1
In this particular simulation, 5 boxes had to be purchased to win the fi rst CD, another 5 to win the next CD, 2 to win the third CD, and so on. In all, this simulation contained 27 wins. The data can be summarised in a table and graph like this:
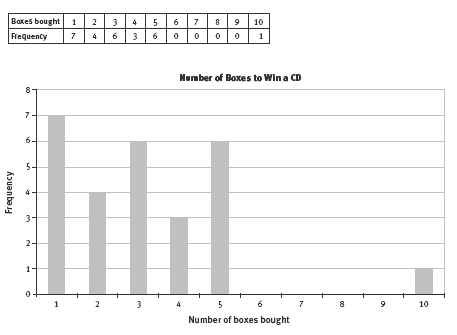
When a group of 5 pairs graphs their accumulated 100 trials, they are likely to fi nd that an orderly graph appears out of randomness. This is well worth sharing and discussing. (The graph of 100 trials will have a more orderly distribution than the trial graph shown above or than any of the graphs that pairs of students make from their own data.)
In answer to the question, the simulation shown suggests that a person should not normally have to buy more than 5 boxes of cereal to win a CD. But clearly, 5 boxes will not guarantee a CD because, in one case, it took 10 purchases. Would 10 boxes guarantee a CD? No. When the outcome is a matter of chance, you can never
guarantee anything!
Extension
You could ask your students to guess what would happen if they did a million trials. The students could also consider: Did the cereal company cost this promotion out using, for example, experiments, simulations, or theory?
Answers to Activities
Activity One
1. a. No. Boxes contain CDs at random, so Pia could get 3 boxes with no CDs in them.
b. Yes, it is possible (but 3 CDs would be very unlikely!). (Note: there is a difference between “possible” and “guaranteed”. See the answer for Activity Two, question 1a.)
2. Practical activity. Results and comments will vary. Afterwards, you may want to tell Pia not to spend her money just in the hope of getting a CD (unless she really
likes the cereal, in which case she might buy a few packets during the promotion). You may want to tell Zareb that you agree with him!
Activity Two
1. a. Unless Pia knows exactly how many boxes are in the competition and buys more than two-thirds of them, there is no guarantee that she will win a CD. (For example, if there were 3 000 boxes in total in the promotion and Pia bought 2 000 of them, she might happen to pick the 2 000 boxes that don’t win CDs. If she bought 2 001 boxes, she would only be guaranteed 1 CD. However, in reality, the more boxes
she buys, the higher her chance of getting a CD. [In terms of spending money, there is no point in buying lots of the product in the hope of getting a CD if it means buying more of the product than you can use. You might be better just saving to buy the CD!])
b. Practical activity. Results will vary.
2. a.–b. Graphs and the features of the distribution will vary
depending on the group results.
c. If you originally thought Pia would win a CD if she bought 3 boxes, you very likely will have changed your mind! There is no guarantee of a prize, and she would probably have to buy at least 5 boxes to win a free CD – and she still may not win!
Key Competencies
Free CD! can be used to develop these key competencies:
• thinking: solving problems in new situations, making decisions, engaging in making sense, making conjectures, and dealing with uncertainty and variation
• using language, symbols, and texts: interpreting statistical information
• relating to others: co-operating and communicating thinking
• participating and contributing: taking on appropriate roles in different situations.