This is a level 4 statistics activity from the Figure It Out series.
Click on the image to enlarge it. Click again to close. Download PDF (300 KB)
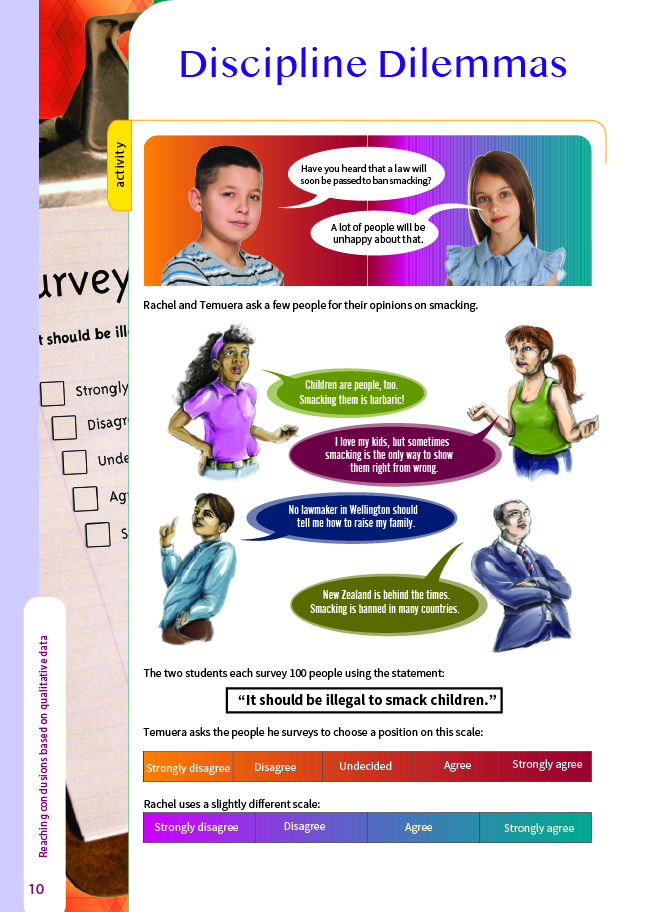
discuss scales as a way to collect data
FIO, Level 4, Statistics, Book One, Discipline Dilemmas, pages 10-11
This activity further develops students’ understanding of the process of designing a survey and builds on the idea that the way a question is asked can influence the outcome. In this case, the categories that are offered control the outcome.
The subject matter of this survey requires sensitive treatment. The parents of your students may have strongly held views at either end of the continuum, including the view that any and all smacking is child abuse. Some of the students may have experienced beatings in the home and assume that this is what advocates of the “right to smack” think is acceptable.
An important lesson that could be drawn from this activity is that when views are being canvassed on emotive issues, the issues need to be clearly defined or the results of the survey will have very little statistical value. A key issue in this activity is the meaning of the term “smacking”. Because it means different things to different people, it is not at all clear what definition any surveyed individual is responding to. This means that the data gathered will not contribute much to the general debate surrounding this subject.
Whenever results from poorly designed surveys are used to “prove” anything, statistics have been misused. Encourage your students to ask questions whenever they encounter statistics, such as:
- “Where is this data from?”
- “How large was the sample?”
- “How was the data collected?”
- “What was the intention of the person collecting the data?”
Answers to Activity
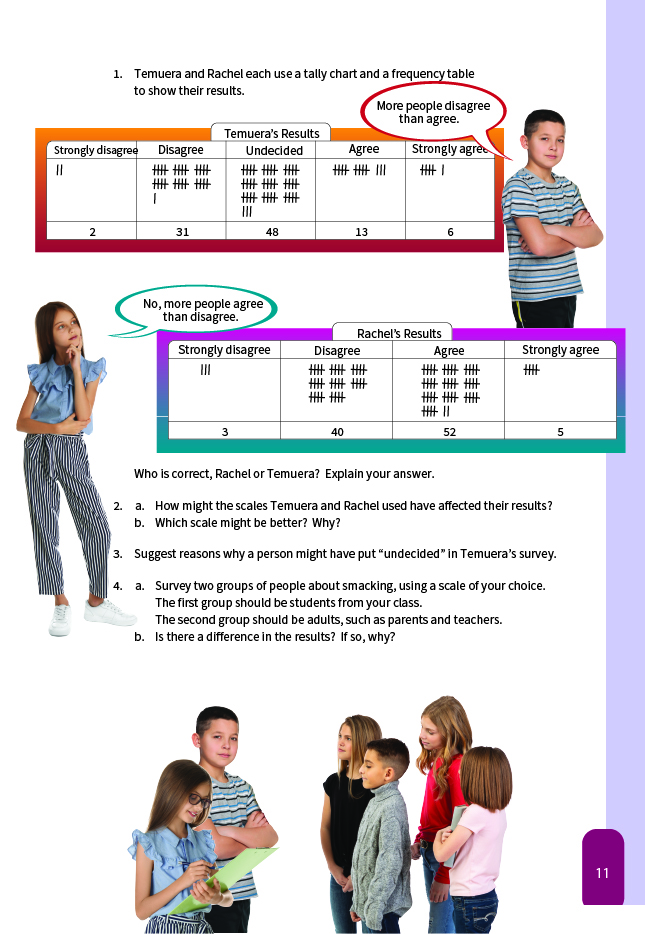
1. Temuera is correct. 33 people disagree, and 19 agree.
Rachel is also correct. 57 people agree, and 43 disagree.
2. a. Rachel’s scale requires people to have a definite opinion. Temuera’s scale allows people to “opt out” and avoid making a decision.
b. It depends what you’re looking for. Temuera’s results are useful in that they show that a large number of people don’t have feelings one way or the other. Rachel’s survey shows that when people are forced to make up their minds, most decide against smacking. But are forced opinions worth much? Both surveys show equally well that few people feel strongly about smacking.
3. “Undecided” people either may not have a definite opinion or may see both advantages and disadvantages in the proposition.
4. a. Results will vary.
b. Children may be more strongly against smacking because they have had some recent experience of being smacked. Parents may feel that smacking is an important discipline tool.