This is a level 3 and 4 number link activity from the Figure It Out series. It relates to Stage 6 and 7 of the Number Framework.
A PDF of the student activity is included.
Click on the image to enlarge it. Click again to close. Download PDF (250 KB)
order whole numbers
find a percentage of a whole number
A calculator
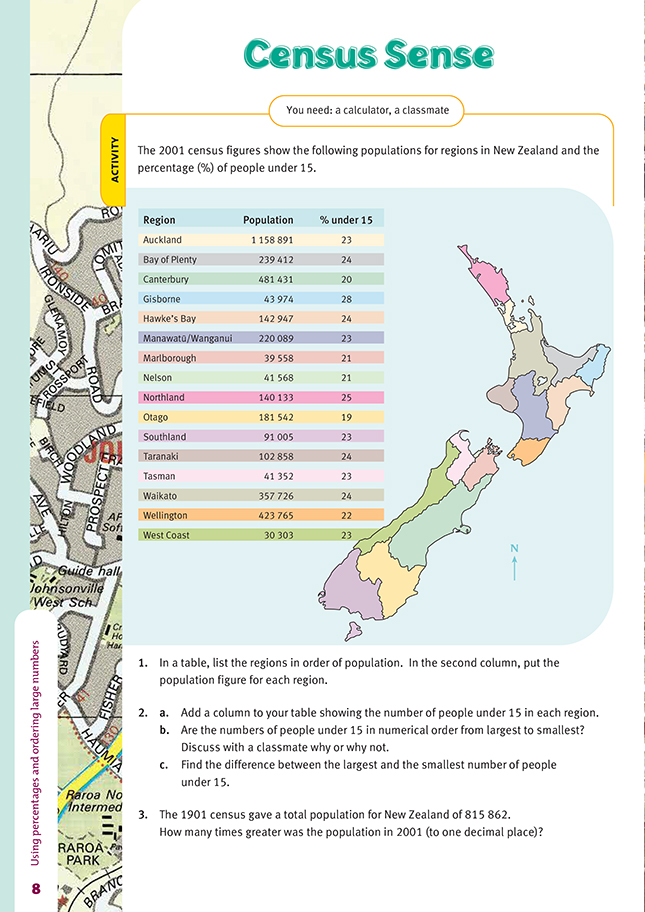
FIO, Link, Number, Book Five, Census Sense, page 8
A classmate
This activity helps the students to develop a better sense of numbers in the tens of thousands and hundreds of thousands. It uses authentic data and therefore reinforces the relationship between mathematics and our lives. After the 2006 census, students will be able to access the latest census data for comparison on the Department of Statistics website www.stats.govt.nz
As an extension, the students could compare the 2001 figures given on the students’ page with the previous census figures from 1996. The map on the following page shows the 2001 regional population figures and the increase (+) or decrease (–) since the 1996 census. The students could use this to work out the 1996 population figures, which they could check from the table below the map. You could use the table, which includes the percentage of people under 15 years of age, as the basis for a discussion on changes and possible trends.
In the activity, question 1 involves putting the population figures in order according to size. Most students are likely to put the largest region with the largest population at the top, but it would be just as acceptable for them to put the smallest at the top. This could even be a worthwhile discussion point, with different students giving their views on the matter.
Question 2 requires more in the way of mathematical understanding and calculation. With this problem, you may need to help some students to see that finding a percentage using a calculator requires them to convert the percentage to a decimal and multiply. For example, if their calculator has a percentage button, they can
find 23% of 30 303 (people under 15 years old on the West Coast) by entering 30 303 x 23 % . Alternatively, they could convert 23% to 0.23 and then enter 0.23 x 30 303.
This authentic data and the discussion stemming from question 2b may lead the students to question the figures. For example, some may ask, “Why is it that people under 15 make up only 20% of the Canterbury population whereas they make up 28% of the population in Gisborne?” This is a social studies issue, but it is likely to involve problem solving using numbers.
Question 3 involves more work than the students may realise at first because they need to add the population figures for each region before they can solve the problem.
Answers to Activity
1.–2.
a. Note that the under-15 figures differ slightly from those provided in the official 2001 census because the percentages given in the students’ book are rounded to the nearest whole number.
b. The number of people under 15 will not correspond exactly to the regional order because the percentages vary from 20% to 28%, but the list should be more or less in decreasing order. For example, 20% of Canterbury’s total will be a lot more than 25% of Northland’s total.
c. 259 575
3. The population in 2001 (3 736 554) is 4.6 times greater than in 1901.