In this unit, which explores the context of voting, students will become familiar with and apply the five key steps of carrying out a statistical investigation.
- Pose investigative questions.
- Design data collection methods.
- Collect and collate data.
- Display collected data in an appropriate format and make statements about the displays of data.
- Make conclusions based on a statistical investigation.
In this unit which explores the context of voting, students will become familiar with and apply the five keys steps of carrying out a statistical investigation:
- Pose investigative questions.
- Design data collection methods.
- Collect and collate data.
- Display collected data in an appropriate format and make statements about the displays of data.
- Make conclusions by answering the investigative question based on a statistical investigation.
These five are closely linked, as what data is collected can dictate the way that it is displayed and the conclusions that can be reached from the investigation. On the other hand, if some restrictions have been placed on the means of display, only certain types of data collection may be relevant.
At Level 2, you can expect students to be posing (with teacher support) a greater range of questions, including investigative questions and survey questions. They will also be helped to understand some of the issues involved in conducting surveys and learn new methods for collecting data. While at Level 1 students collected data and chose their own ways to display their findings, at Level 2 they will be introduced to pictographs, tally charts and bar charts. More emphasis here will also be placed on describing the data and the making of sensible statements from both the student’s own displays and the displays of others.
Investigative questions
At Level 2 students should be generating broad ideas to investigate and the teacher works with the students to refine their ideas into an investigative question that can be answered with data. Investigative summary questions are about the class or other whole group. The variables are categorical or whole numbers. Investigative questions are the questions we ask of the data.
The investigative question development is led by the teacher, and through questioning of the students identifies the variable of interest and the group the investigative question is about. The teacher still forms the investigative question but with student input.
Associated Achievement Objective
Social sciences AO2: understand that people make choices to meet their needs and wants.
The learning opportunities in this unit can be differentiated by providing or removing support to students and by varying the task requirements. Ways to support students include:
- giving students summarised data to graph rather than them having to collect it and collate it
- giving students a graph of the display and asking them to “notice” from the graph rather than having them draw the graph.
The context for this unit can be adapted to suit the interests and experiences of your students. For example:
- you could vote on a tree to plant in the school, plants for the school/community garden or a game to play at the end of the week. The "favourite" example can be adapted to explore any favourites within the classroom context.
Te reo Māori vocabulary terms such as, raraunga (data), kauwhata tāhei (strip graph) and kauwhata pou (bar graph) could be introduced in this unit and used throughout other mathematical learning.
- Paper cut into squares for voting
- Large sheets of paper and pens for recording.
The teaching sequence is designed for teachers to guide students through the five key stages of a statistical investigation. The context used is voting for a native tree which is to be planted in the school. You may choose to conclude the unit by buying and planting the chosen tree, or you may prefer to simply vote on students’ favourite tree. At the end of this unit other possible statistical investigations are provided as examples of what students might further investigate in pairs or small groups. This would allow for the unit to be extended beyond a week.
Session 1
This session is about framing the context for an investigation, and deciding on an investigative question, a sample, and a method of investigation.
- Introduce the topic by explaining that we are going to choose a favourite tree for the school. Four native trees have been selected as the most suitable and our class is responsible for organising the senior classes for the final voting. The four trees at the top of the list are: totara, kauri, kowhai and ti kouka. We need only one of these trees and it will be planted where there is plenty of space. We want this tree to have special significance and to represent the pupils who attended our school as well as future students. Some of the meanings associated with the trees selected include:
- Totara - life and growth,
- kauri - strength,
- kowhai - personal growth and moving from the past with renewed adventure and
- ti kouka - independence.
- Start the discussion by asking “What are some of the special features of these four New Zealand trees?” Brainstorm the features on a large sheet of paper. Ask students to think about which tree they would like and why. “Which tree will we choose to plant in our school?” (a. our investigative question).
- Examples of tally charts or lists or specific criteria could be used to exemplify ways of collecting such data. Organise students into groups of four to ask them how might this data best be collected? Remind students of the purpose of collecting data. (b. How might we design and collect data to answer our investigative question?).
- As a class, share ideas from each group. What ideas have each group come up with? Come to a consensus of the method for collecting the data ready for the next day.
- Decide who the participants should be. (c. Who are we going to ask? How many classes? If the school population is too large limit to two or three classes).
Session 2
This session is about going through the voting process and collecting the data in a systematic way.
- Recap the discussion from the previous day and encourage students to think about what we are trying to find out and why are we carrying out this investigation?
- Have the nominated tree names written on labels. Use the data collection method that was decided upon in the previous day’s discussion. Further teaching on tally marks and how they work may be needed depending on the needs of your students. Why do we use tally marks when collecting large amounts of data?
- Give students two square pieces of paper: one for the votes of other classes, and one for their own vote.
- Everyone will be asked to write down the name of the tree they are voting for on the square piece of paper.
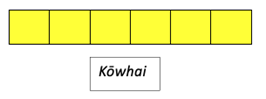
- On returning to the classroom, ask everyone to sort their votes in groups. Ask them to sit in a circle with their data cards in front of them. Hold up the name of a nominated tree and invite those people who voted for kōwhai to bring their voting square to the front. The voting squares are placed side by side as illustrated below.
- The process is then repeated for the other nominees and the voting squares are added on to make a long strip.
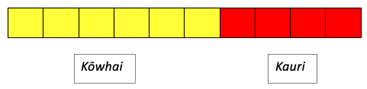
- Complete until all votes are represented in the strip.
- Ask students to make statements about what they can see from the strip and relate this to their investigation.
Session 3
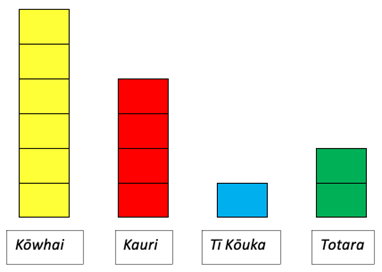
In this session students will see how a strip graph (kauwhata tāhei) can be transformed into a bar graph (e.g. How are we going to display our results? In tables? What is the best graph to use?).
- Break the strip graph into the votes for each tree. Place the name labels at the bottom of the graph and place each piece of the strip graph above the appropriate name, as illustrated below.
- Ask the following questions:
What would be an appropriate title for our graph?
What labels could you use for this graph and where would you write them? - Label the axes and give the bar graph (kauwhata pou) a title so that others could make sense of the display. A good idea is to write the investigative question as the graph title.
- Ask the following questions:
Is this a helpful way of presenting this information?
It is easier to make statements from a bar graph or from a strip graph?
Which completed graph shows our results most clearly?
The questions could be asked in a whole class situation or students could complete a bus stop activity with the questions being posed on the top of a large piece of paper and students visiting each station to record their ideas. Small groups would also be a valuable way for ideas and responses to the questions to be discussed and explored. - Summarise the responses and make recommendations about when each graph might be a useful way of presenting information
Ask the students what they notice about the information shown on the bar graph. Use the prompt “I notice…” to start the discussion. These “noticings” could be recorded as speech bubbles around the bar graph. - Conclude by revisiting the original investigative question posed: "Which tree will we choose to plant in our school?" Make statements from the results to answer the original investigative question (e. What is the answer to our investigative question based on the results of our investigation?).
Session 4
In this session students discuss the types of things that are worth investigating and carry out their own investigation.
- Talk about the types of things that are worth investigating. It is important that possible investigations are relevant to what is happening in the students’ lives and what is happening at school at the time. Possible investigative questions may include:
What game should we play at the end of the week?
What should we spend the fundraising money on?
What should we plant in the school/community garden? - Encourage students to review the process they went through to decide how they were going to collect and present the voting data. List the process as questions that students can refer back to. For example
- What is our investigative question?
- How will we collect the data to answer our investigative question?
- Who are we going to ask? How many people are we going to ask?
- How are we going to display our results? In tables? What is the best graph to use?
- What is the answer to our investigative question based on the results of our investigation?
- Students can now work in small groups or pairs to carry out their own investigation. This could be completed as a homelink activity or as a follow up activity.
- Results should be shared and conclusions made based on the results. This investigation is likely to require at least three sessions of fairly intensive work; one session of planning and checking, one session of collecting and displaying data, and one of developing statements and conclusions and presenting these. Digital links could be made by directing students to display their graph and findings as a PowerPoint or set of Google slides.
Dear parents and whānau,
In mathematics, we have been voting for a tree to plant. We have been using this information to make strip graphs and bar graphs. We have also developed our own statistical investigations.
Please talk with your child about what they have been doing in maths and take any opportunities that arise to discuss with them any simple statistical information that may be presented in the newspaper or on television.
Thank you.