The purpose of this unit is to conduct statistical investigations into the relative popularity of different text and print features, using data squares as the data gathering tool.
- Pose an investigative question.
- Design and carry out an investigation.
- Answer questions by sorting, organising and arranging information.
- Make statistical displays of the collated data.
- Make sensible statements about the information with supporting evidence.
- Critique the investigation process.
- Pose further questions for investigation.
A piece of written text has a range of features that combine to form its particular structure. These features can have different forms. The multiple possible combinations of these can result in quite different ‘nuances’ of the same text. As students develop their writing skills, and as their audience awareness grows, they may develop curiosity about how and why texts appeal to different audiences. This curiosity can form the purpose for this unit of investigation.
Investigating the preference for possible combinations of text and print features requires the gathering of multivariate data. Therefore, during their investigation students will need to draw upon well-developed number strategies to think multiplicatively and to reason in a proportional way. When planning their investigation from an ‘I wonder’ statement, students need to consider the questions they will ask, how they will gather data, and how the data will be organised when it is collected.
Data squares are one tool that can be successfully used to gather this data. Data squares can hold several pieces of information about individual preferences, however, it is important that students understand the difference between individual data (representing an individual) and group data (representing a group). Sorting and organising a set of data squares means that the group preferences for combinations of text and print features can be discovered, feature by feature. The questions about the preferred combinations of features can also be answered, as the data squares allow students to consider combinations of more than one variable at the same time. At level 3, as students learn to investigate data sets with many variables, they begin to learn how to sort, re-sort and display the data, and begin to see relationships between the variables.
The conclusions students draw from their data should directly relate to their original question and to the data they have gathered. When answering questions and presenting the findings of their investigation, students need to make statements about the group and accurately describe features of a data set. Through this, students learn to identify patterns and trends in context, both within and between data sets. In doing so they should be encouraged to develop a wider statistical vocabulary, including reference to multivariate data, datasets, variables, frequencies and proportions. They should also be given the opportunity to reflect upon and critique their investigation process and recognise its limitations.
The learning opportunities in this unit can be differentiated by providing or removing support to students and by varying the task requirements. Ways to differentiate include:
- modelling the creation of a data set using data squares in a whole class setting before students investigate independently or in pairs
- modelling and co-creating questions to be answered using the data squares
- showing students how the data squares can be sorted and used to create displays
- working with a single variable first, such as font or graphic type, before working on questions that involve multiple variables
- providing opportunities for tuakana teina (peer learning) and mahi tahi (collaboration) to promote students supporting each other
- working with a small group of students, who would benefit from additional support, to plan and conduct an investigation (or parts of it)
- modelling the use of graphing technology (e.g. Google Sheets, Microsoft Excel) and manual methods to sort data and create displays, and providing opportunities for students to use these methods.
The context for this unit is analysis of the graphic and text features of a Connected article. Note that this mathematical investigation should be complemented by literacy/English lessons that focus on developing the necessary knowledge and understanding of relevant particular text features. Much can be gained by using texts that are engaging to your students. Other text types, such as comics, plays, novellas, graphic novels, advertising brochures, poetry, album covers, music videos, posters or websites may provide an alternative context for this unit.. Exploring the text and graphic features of different genres can lead to an inquiry into why different features are used for different purposes, and the intended effect of using those features. Consider choosing a text that reflects relevant content (e.g. culturally-relevant content, content to do with your current inquiry topic).
- A class set of your chosen Connected 2 text (note: Connected Texts published after 2013 are available on TKI as Google Slides.)
- Paper
- Copymaster One
- Copymaster Two
Whilst this unit is presented as a sequence of five sessions, more sessions than this may be required or desirable to consolidate key learning. It is also expected that any session may extend beyond one teaching period.
Session 1
This session is about planning an investigation into optimal text (and print) features.
SLOs:
- Pose an investigative question.
- Design and carry out an investigation.
Activity 1: Identify visual language features
- Introduce the focus of the activity.
We are going to plan an investigation to find out which combination of text (and print) features is the most appealing to the people in our class. This will help us to become better writers, because we will be more aware of how to engage our audience when writing.
Begin by making available to each student, a digital or paper copy of your chosen Connected (non fiction) text..
Have students browse the contents. You may have already introduced the text in a literacy block. If not, spend adequate time reading and developing understanding of the information presented in the text.
- Ask students to identify the visual language features (e.g. maps, diagrams, drawings, photographs, graphs, timelines). Give students time to talk, with a partner, about what these might be. Share the ideas and generate a list of visual language features on the class board.
Have students focus on the visual language features in the text and use these to choose their favourite double page in the book. Ask them to ad explain to a partner what it is they like about the visual language features on those pages. Students could record why they have chosen a page as their favourite on post-it notes on different parts of the pages. Display the post-it notes on a class chart, or on the pages of the text (if you have a hard copy).
- Emphasise that some people like the same pages and visual language features, and other students have different preferences. The overall impact of any double page depends on the combination of visual language features and the text (and its written features)..
Activity 2: Identify written text and print features
Using the same text, focus students on the written text only.
Together, make a class list of the written and print features they notice in the text. These features might include title length, text breaks, (the presence of) subheadings, paragraphing, sentence length, line spacing, the use of bold lettering, the use of bullet points, font, and (the amount of) direct speech. To extend students, ask them to compare these features with those in another text from the same genre.
Work through several of these features, one at a time, and have students identify which they personally prefer. Have them explain why to a partner. Emphasise that audiences can have different responses to text structure and print, and different preferences.
Activity 3: Develop investigative questions
- Ask the students to generate ‘I wonder’ statements about text format and graphics. For example:
“I wonder which is the most popular combination of features?”
“I wonder which features I should use if I really want a classmate to read my work?”
“I wonder if different features of text or print appeal to different age groups?”
“I wonder if particular features are used for different purposes?”
Record these for reference on a class chart or digital document (e.g. Padlet, Google form or sheet).
- Have students work in pairs (tuakana-teina) to discuss their ideas. Together, have them write a question they can investigate. For example:
“What is the best combination of text features to use?”
- Have students consider how they would carry out the investigation of their question. Many suggested questions may be too open. If so, the students will need to refine their question by being more specific and narrowing the focus. They will also need to consider any words in their question that are ambiguous or unclear.
- Use the questions proposed by students to model refining an open question.
For example:
“What kind of text features do senior students like?” This is a broad question - there are lots of different types of text features, and we could be more specific about the group of students. “What kind of title, font, text breaks and line spacing do students in our class (Y6) prefer?” is a more specific question. It tells us what specific text features we are investigating, and identifies a specific group of people to be surveyed in our investigation. Give students time to refine and narrow their questions, then have them share their unrefined and refined questions with another pair, or with the whole class. Record the newly-refined questions and discuss them as a class.
Activity 4: Develop plans for investigating our questions
- Display one question as an example: eg.
“What kind of title, text breaks, font and line spacing do students in our class (yr 6) prefer?”
Discuss together and recognise that there are multiple features of a text. Introduce the term multivariate data, meaning data that consists of measurements of three or more attributes or variables, such as age, height, and gender, for each individual or object in a sample. Provide students pairs with time to discuss and formulate a plan for their data collection.
- Have pairs of student share their plans and adopt a plan, if appropriate.
Alternatively, build upon their ideas and propose a shared plan to collect the data.
- Make Copymaster 1 (enlarged to A3) available to each pair of students. Explain that they will use this data gathering tool: ‘data squares’. Point out that the quadrant form of each data square allows datasets (collections of data) representing four categories to be collected.
Direct students to:- Select a participant cohort. For example, all members of this class, all members of another class/year level in the school, girls in a class, boys in a class, adults in the school.
- Select four text features (e.g. paragraphing, sentence length, line spacing, the use of bold lettering) that they would like to investigate.
- Write an engaging short (up to one page) article or report to use for the investigation. Articles from Connected could be used as inspiration, or provided for students to use as their report for investigation.
- Make three variations of each feature and label each set differently. For example, ABC; 1,2,3; i, ii, iii; X,Y,Z; etc. See Copymaster 2.
In each set (of three), only vary the feature that is being investigated. Keep the rest of the text the same in each example. - When investigation material is complete, have each participant record their text feature preference on the identified quadrant of the data square.
For example: (variation shown in red)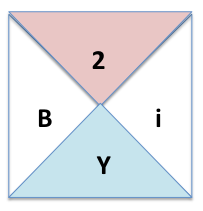
- Have students interpret the data square response of the example participant.
This person prefers:
a clever title, paragraphs, cambria font, and medium line spacing.
- Have students recognise that the varied text examples can be easily created, by adjusting the variables for investigation within a Microsoft Word, Google Docs (or similar), and printing each change, or sharing the document as a template/view only.
Activity 5: Conclusion
Conclude the session by having student pairs complete steps 1 and 2 only in the process outlined above in Activity 4, Step 3.
Session 2
This session is about preparing the resources to carry out the investigation and predicting an outcome.
SLO:
- Prepare resources for an investigation.
Activity 1: Preparing for investigation
- Begin by reviewing the purpose of the statistical investigation - to conduct a statistical investigation into preferred text and print features, to better inform us as writers, of how we can present our work in a way that appeals to a particular audience.
- Review the process outlined in Session 1, Activity 4.
Have students pairs share the decision they made about steps 1 and 2 in Session 1, Activity 5.- Select a participant cohort. For example, all members of this class, all members of another class/year level in the school, girls in a class, boys in a class, adults in the school.
- Select four text features to investigate.
Discuss as a class the variations of each feature that each pair has chosen according to the participant cohort identified.
For example: For a Year 2 cohort, the text features may be size of font, sentence length, font type and line spacing.
For a Year 8 cohort, the features may be title style, paragraphs, the use of subheadings, and line spacing (text density).
Identify that the focus of this session is to complete steps 3 and 4: - Write an engaging short article or report to use for the investigation.
- Make three variations of each feature and label each set differently. For example, ABC; 1,2,3; i, ii, iii; X,Y,Z; etc. See Copymaster 2.
- Remind students that in each set (of three), they should only vary the feature that is being investigated. Keep the rest of the text the same in each example.
- Allow time in the rest of the session for the text to be written and for the material for the investigation (copies of the variations of the text format) to be completed.
- As appropriate, make arrangements with other classes in the school for a suitable time in which data can be collected.
Session 3
This session is about explaining the investigation to participants and gathering data.
SLOs:
- Explain to investigation participants (sample) how the data will be collected.
- Collect data.
Activity 1: Sharing materials and making predictions
- Have student pairs explain to the class, the investigation material that they have prepared and the purpose of their investigation.
- Students should predict which combination of factors they think will be preferred by their chosen audience and why they think this. Have them record and share their predictions and reasons.
Activity 2: Preparing for data collection
Have student pairs prepare for their data collection by cutting their copies of Copymaster 1 (enlarged to A3) into individual data squares, and practise how they will present their investigation to their participant group.
They should consider how the sample group (audience) will know about and understand the purpose of the investigation, how the pair will display the variables in the investigation (the four sets of text), exactly how they will explain the process of completing the data squares (including that each person will complete just one square), and where participants should put their data square when completed (eg. in the white plastic container). They should also give opportunities for questions from their audience.
Activity 3: Collecting data
Allow time in this session for data to be collected. Roam and support pairs of students as needed.
Activity 4: Looking for patterns in our data sets
As pairs of students complete their data collections, have them layout and manipulate their data squares, beginning to look for patterns and relationships, and identifying any initial findings. During this, pairs could share with another pair, or you could hold small-group check-in sessions with a few pairs at a time.
Session 4
This session is about sorting information into categories, organising data, identifying patterns and relationships and displaying data in a statistical form.
SLOs:
- Answer questions by sorting, organising and arranging information.
- Make statistical displays of the collated data.
- Make sensible statements about the information with supporting evidence.
Activity 1: Sorting data - one variable at a time
Have students begin to sort their data by examining one variable (univariate) at a time and recording the results with tally marks.
For example: The title preference variable (ABC) is sorted.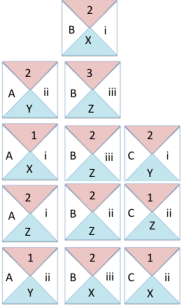
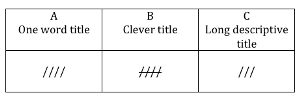
Activity 2: Presenting data with simple graphs
Have students present these data as simple bar or pie graphs. These could be created by hand or with the use of digital tools (e.g. Microsoft Excel, Google Sheets).
Have them make statements about preferences.
For example: 1/3 (33.3%) of the audience preferred a one-word title, 5/12 (41.7%) preferred a clever title, and 1/4 (25%) preferred a long descriptive title.
Where possible use computer software to create graphs and seek patterns.
Activity 3: Looking at two-variable data
When students have considered each variable and recorded the results, have them look for patterns and relationships between two variables.
For example: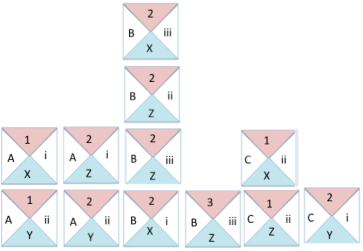
1/3 (33.3%) of the audience preferred the clever title and paragraphs. (B,2)
None of the audience liked the clever title and no text breaks. (B,1)
Activity 4: Looking at data from three or more variables
Have students identify patterns and relationships between three or more variables, recording statements, supported by evidence.
Ask students to confirm whether the predictions they made in Activity 3 were correct.
Activity 5: Answer the investigative question
Ask students to refer to and answer their investigation question. Explain that their answer is likely to have several parts to it because they are ‘synthesising’ their answer from multivariate data.
Activity 6: Applying our results to a wider sample
Have students consider whether the answer to their question applies to their sample only (Yes) or whether the information is representative of a wider group and can inform a general statement. (No).
Session 5
This session is about students considering the effectiveness of their investigation, identifying further questions that their investigation raises, and presenting their findings.
SLOs:
- Make sensible statements about the information with supporting evidence.
- Critique the investigation process.
- Pose further questions for investigation.
- Present findings.
Activity 1: Introduction
Begin by explaining that this session has three parts. Pairs of students should:
- Critique their own investigation process and suggest how they might improve it if they were to repeat it in the future.
- Consider whether their findings would lead them to pose further questions for investigation, and if so, to list these.
- Present their findings, their critique and their further questions to their classmates.
Activity 2: Presenting findings
- Allow students time to complete steps 1 and 2, before presenting their findings to the class. This may be an oral presentation supported by a digital presentation (for example, a video or PowerPoint, a poster or a combination of these.
- Have classmates give specific feedback on findings and presentations. Give students clear expectations on the type of feedback they are to give to their classmates (e.g. 2 positives, and 1 could-be-improved).
- If appropriate, student pairs could present their findings to audience participants if they are other than their own class.
Activity 5
As a class, conclude the session by listing key learning about text and print features, and about conducting an investigation into multivariate datasets.
Dear parents and whānau,
Do you know what kinds of text and print features appeal to you?
In our class we have been combining our English and mathematics learning in a recent study.
Please ask your child to tell you about the results of our statistical investigations into the type of text and print features that different audiences prefer.
You may be quite surprised by what we have found out!